Network Observability and Monitoring

Go beyond bandwidth utilization and health statuses. Troubleshoot communication errors, optimize performance and monitor compliance across your hybrid environment.

Launch demo
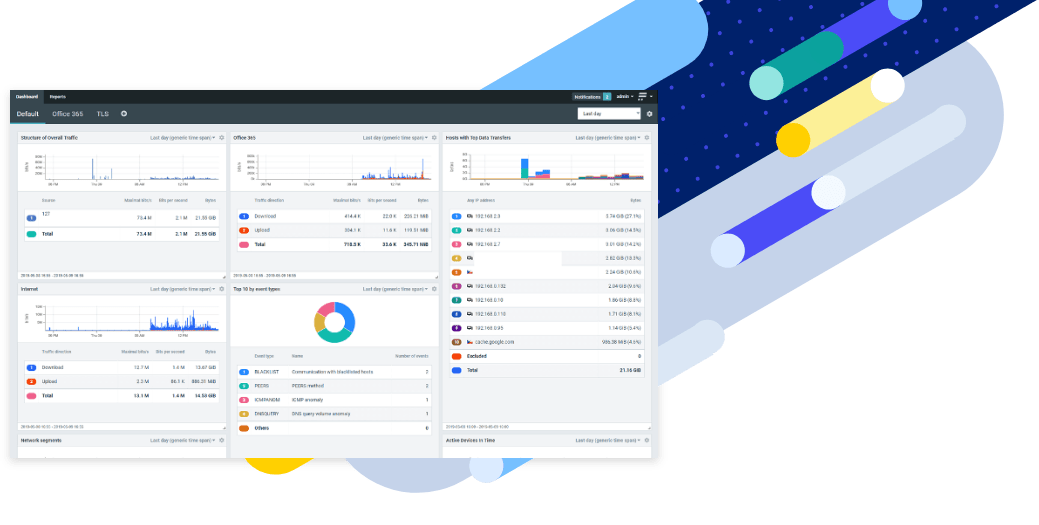
Network Observability

Improve Your Network Resiliency to Support Mission-Critical Services

troubleshooting

Troubleshoot up to 95% of root causes

Gain deep insights to troubleshoot up to 95% of root causes, minimizing downtime and creating a more seamless user experience.

know and respond

Know More, Respond Faster

Get real-time monitoring insights on usage, applications, users, devices and network services to help you stay ahead of issues and maintain peak efficiency.

Wide platform support

End the Blame Game

End-to-end visibility reduces ambiguity and helps you understand root causes, fostering a collaborative environment focused on resolution, not blame.

Anomaly

Optimize Your IT Technology Stack

Integrate network bandwidth and health, traffic analytics, forensics, performance monitoring and packet capture under a centralized dashboard across any hybrid environment.

Clear, Actionable Insights with Deep Intelligence on Demand

Imagine understanding the health of your entire office network, data center, servers, SaaS and cloud with clear indicators on a unified dashboard. Now imagine receiving insights that enable you to observe multiple users’ communication, troubleshoot DNS error codes, distinguish between network or application performance issues and inspect packets on demand—all within a unified interface. This is precisely what Progress® Flowmon® offers—and it’s achievable through a simplified 30-minute deployment, with as little as one virtual appliance.
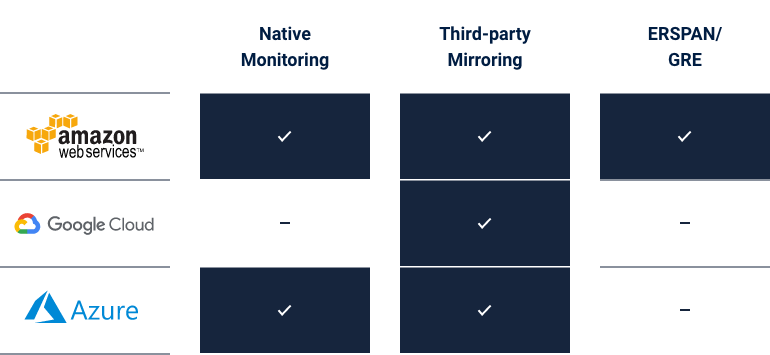
Flowmon supports hardware, virtual and native cloud deployments on AWS, Google and Azure. The system can also scale to handle up to millions of traffic flows per second. This enables network-wide deployments and helps maintain extensive visibility coverage and data retention for hybrid environments.
Comparison table
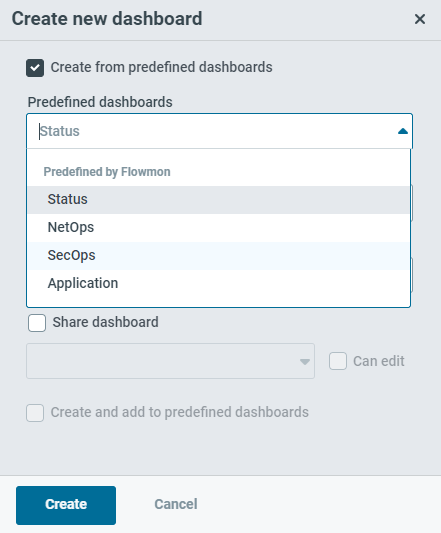
Select from a gallery of predefined dashboards featuring topology maps, bandwidth visualization, top statistics, traffic charts, alerts and more. These dashboards streamline the process of gaining quick insights and accelerate your ability to control applications with precision and clarity.
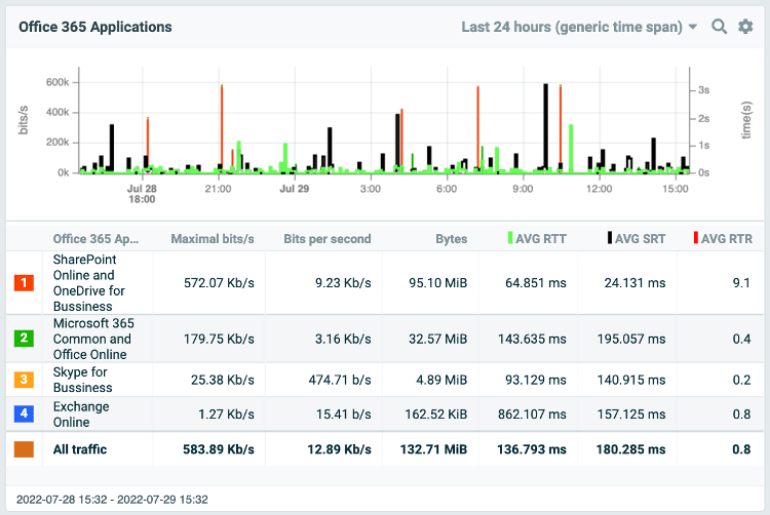
Achieve end-to-end performance monitoring, allowing you to monitor user experience and measure application vs. network and application vs. database delays. Track Server Response Time, Round Trip Time, Jitter, Retransmissions and Delays for every user and every in-house or SaaS application.
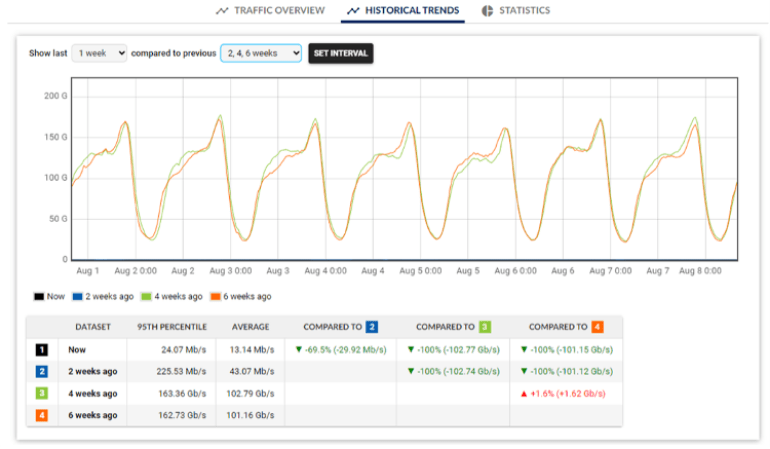
Utilize trends and predictive analytics to measure network performance over the long term. Compare volumetric statistics and predictively evaluate capacity needs to avoid bottlenecks and downtime. This approach enables better planning for infrastructure design and upgrades while optimizing network performance.
Enhance your network capabilities with broad compatibility in Flowmon, allowing you to leverage switches, routers, network access control, load balancers, packet brokers or even firewalls to send network telemetry data more seamlessly. The solution supports diverse traffic flow standards, including proprietary formats. For deeper insights into the application layer, opt for Flowmon Probes.
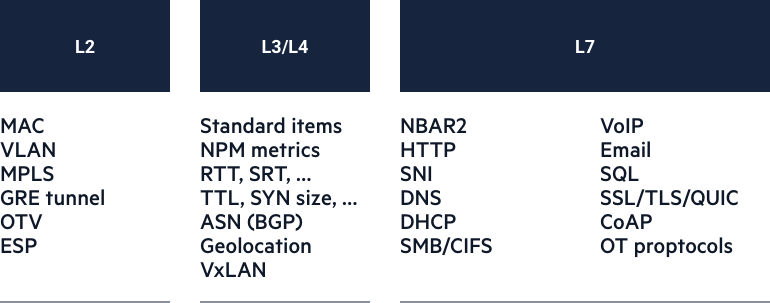
Experience the power of Flowmon Probes as powerful passive network sensors offering application layer visibility and support for various enterprise protocols. These probes facilitate the monitoring of network performance, application performance and delays—and even provide full packet capture capabilities.

Examine Whitepaper: How to Transform Your Network Operations with Flow Data​

Explore Whitepaper: Advanced Analysis of Data Network Traffic

Discover Whitepaper: A Holistic Look at Security, Monitoring and Application Experience