
Monitor User Experience and Optimize Application Delivery
Progress® Flowmon® can track real-time user experiences and proactively manage application performance to cut down on problem-solving time, minimizing disruption to your business operations.
Launch demo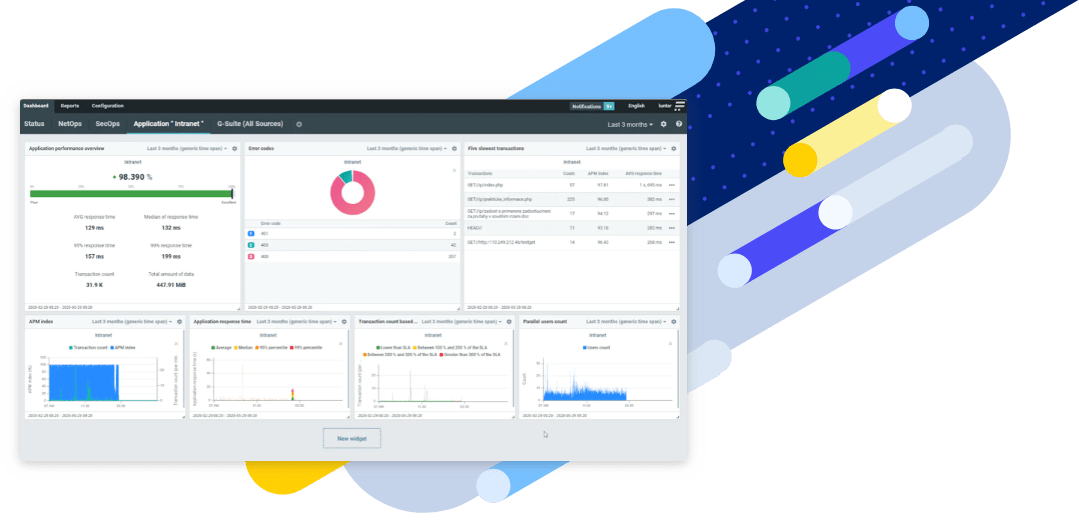
Improve Your Network Resiliency to Support Mission-Critical Services

Troubleshoot Up to 95% of Root Causes
Gain deep insights to troubleshoot up to 95% of root causes, minimizing downtime and enabling a smoother user experience.

Know Everything, Respond Faster
Get real-time monitoring insights on usage, applications, users, devices and network services to help you stay ahead of issues and maintain peak efficiency.

End the Blame Game
Reduce ambiguity with improved visibility into your infrastructure. Understand root causes more clearly and foster a collaborative environment focused on resolution, not blame.

Optimize Your IT Technology Stack
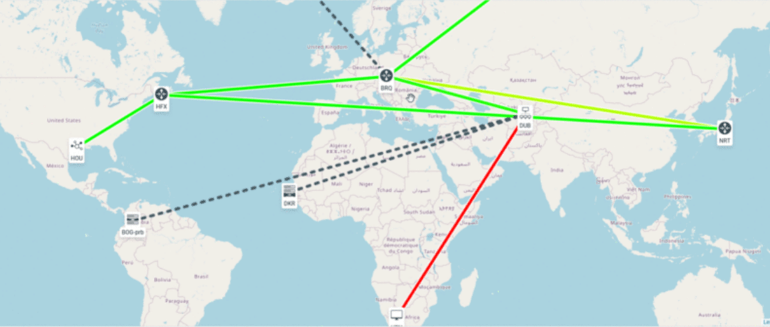
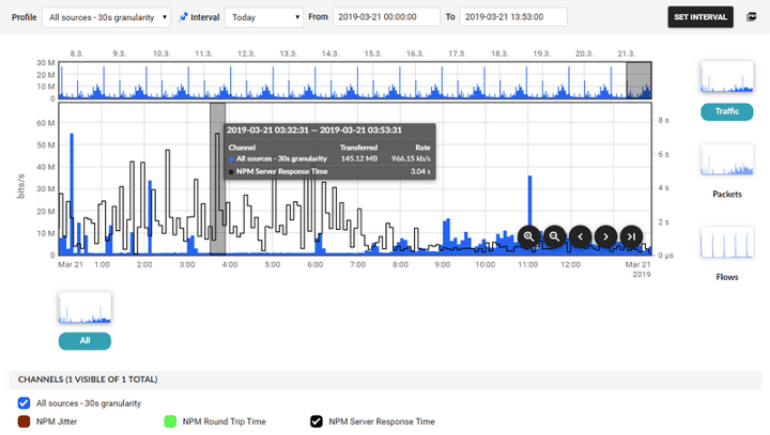
Integrate network bandwidth and health, traffic analytics, forensics, performance monitoring and packet capture in a consolidated dashboard across cloud and hybrid environments.
Clear, Actionable Insights with Deep Intelligence on Demand
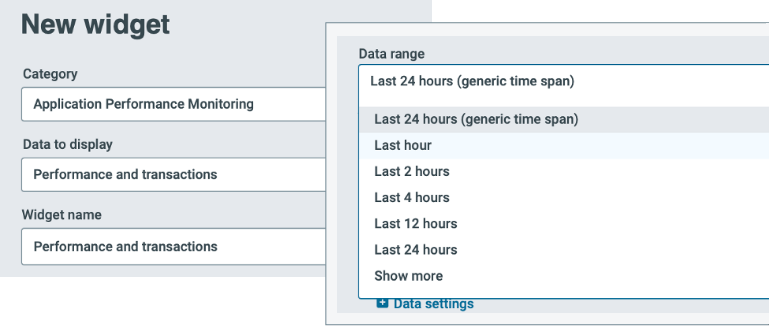
Imagine an automated dashboard built by choosing your widgets from a library of predefined ones, showing red/green statuses to understand network health immediately, without having to toggle between multiple dashboards.
Get Answers to Questions, Like:
- Which users experience the worst application responses?
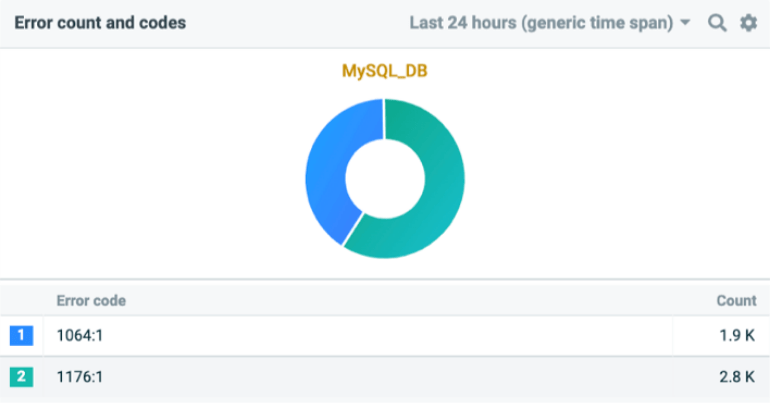
- Which transactions return error codes?
- How severe is the impact of remote access?
- What are the relationships between user and backend transactions?
- How much does the cloud provider’s infrastructure slow down my application?
- Are my internal users productive?
- What are the long-term availability SLAs for my application?
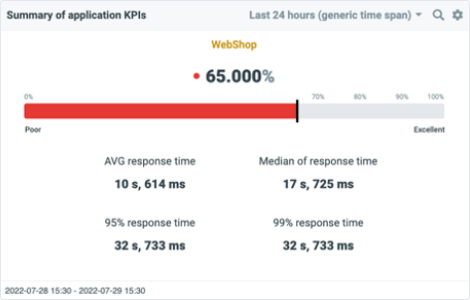
Optimize Performance with Comprehensive Application Visibility
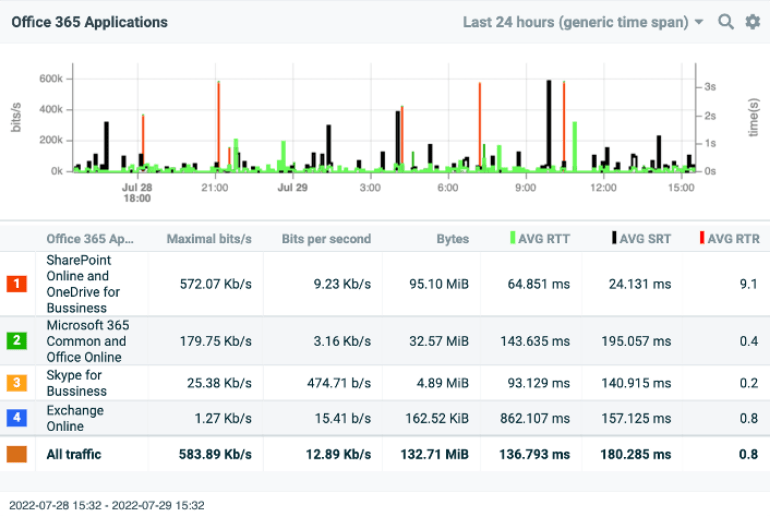
Gain end-to-end visibility into your application delivery chain. Identify bottlenecks, prioritize bandwidth, and troubleshoot errors effectively.
Resource Library
Check out these resources to help you get started with Flowmon.