You could see in previous post how the alerts could be useful. Now it’s time to go even deeper and show you how to create a custom script. My example will do just a simple thing that it will take data of All sources (live) profile and get a top 10 source ports ordered by bytes. The format is a BASH shell script.
Each script if you would like to use values which can be provided from the alert is to start with following.
. /usr/local/bin/fmc_alert_functions
if [ -L $0 ] ; then
  DIR=$(dirname $(readlink -f $0)) ;
else
  DIR=$(dirname $0) ;
fi ;

input_json=$(cat "$DIR/pluginscript_input")
parse_alert_data "$input_json"
I take in my example two fields but more details about those is at User Guide at section 7.8.2 User defined scripts.
So, I start by listing available channels in profile.
PROFILE="live"

CHANNELS="$(ls /data/nfsen/profiles-data/$PROFILE/ | sed ':a;N;$!ba;s/\n/:/g')"
Now once we have this ready we can go ahead and run nfdump command to get the statistic and store it in a file.
/usr/local/bin/nfdump -M "/data/nfsen/profiles-data/$PROFILE/$CHANNELS" -r

         "${ALERT_TIMESLOT:0:4}/${ALERT_TIMESLOT:4:2}/${ALERT_TIMESLOT:6:2}/nfcapd.$ALERT_TIMESLOT"

          -n '10' -S 'srcport:p'/'bytes' -6 > /tmp/topstats.txt
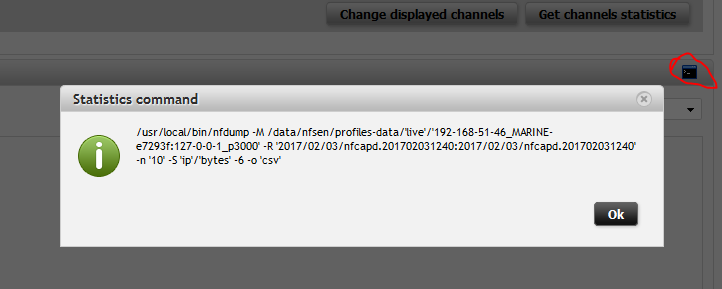
As you could see, I am using the variables created and ALERT_TIMESLOT is taken from the alert itself. If you would like to get different statistics and don’t know which parameters you should use GUI of Flowmon Monitoring Centre will show it to you with every analysis you use.
Figure 1: Used command for the analysis.

The other option is using a manpage of nfdump to get an idea what you are looking for.
We have a top statistics saved in file and now is time to generate a graph. For this we are going to use a fact, that system is using RRD files where we have all statistics so we can use rrdtool to generate custom graph.
The following code will take care of it as it will list channels and get the statistics and draw a charts. The chart will have the same color but for purpose of this demonstration that is enough. Again to know what we can use for the graph check the manual page or examples for rrdtool which is just standard installation.
RRDS="$(ls /data/nfsen/profiles-stat/$PROFILE/*.rrd | grep -v npm)"
DEF=''
LINE1=''
for channel in $RRDS
do
   name=${channel##*/}
   name=$(echo "$name" | awk -F '.' '{print $1}')
   DEF="$DEF DEF:$name=$channel:traffic:AVERAGE"
   LINE1="$LINE1 LINE1:$name#0000FF:'$name'"
done
rrdtool graph /tmp/alarm.png -a PNG --end now --start end-120000s --width 400 --title="$PROFILE" $DEF $LINE1
So, now we have everything ready and we want to send an email. I will create a body in text where I will append the context of top statistics.
        printf "Hello, \n Alert $ALERT_NAME was triggered now. Top 10 source ports are \n\n" >

         /tmp/body.txt

cat /tmp/topstats.txt >> /tmp/body.txt
And it’s time to send an email using CLI interpreter of Flowmon system so it will be sent with configuration done in GUI.
 /usr/bin/php /var/www/shtml/index.php Cli:SendEmail -file="/tmp/body.txt" -

       to="jiri.knapek@flowmon.com" -attachments="/tmp/alarm.png" -subject="$ALERT_NAME"
As a last step I’m going to remove the temporary files I created.
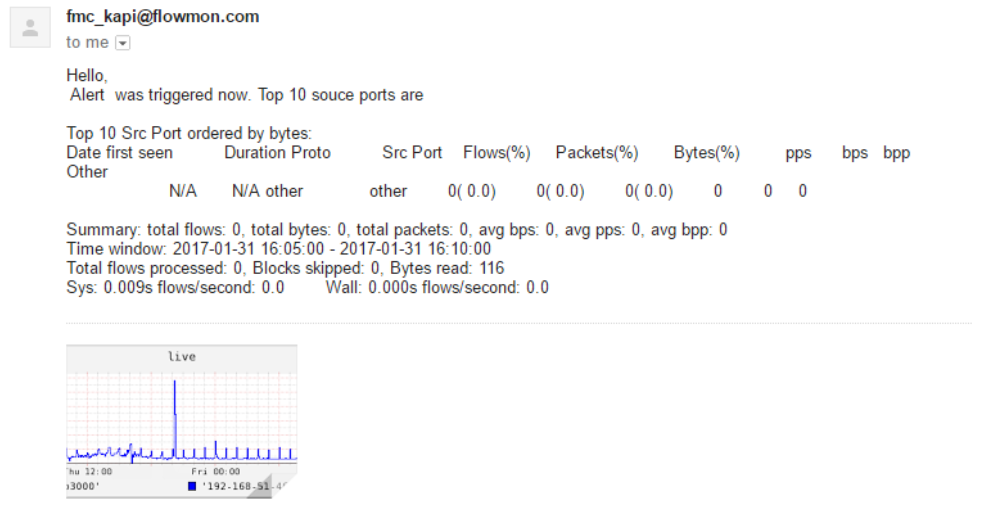
rm /tmp/topstats.txt /tmp/body.txt /tmp/alarm.pngEmail sent by this script looks like this.
Figure 2: Example of email sent by custom script.

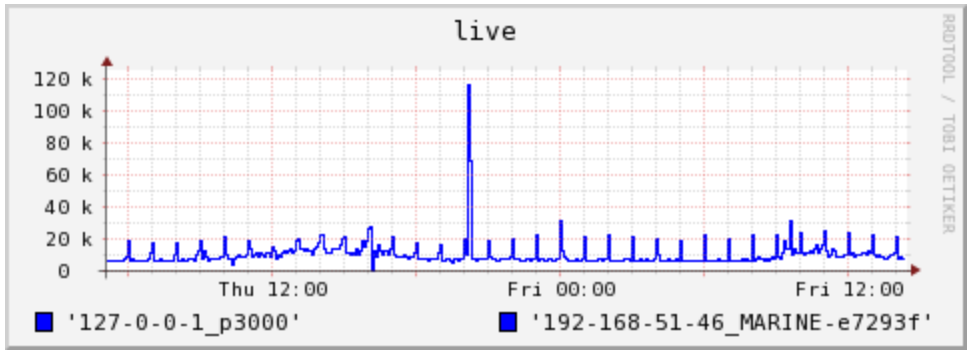
And the graph generated.
Figure 3: Attached graph.

The complete script can be provided on demand – get in touch with us.