NPM Metrics Visualization
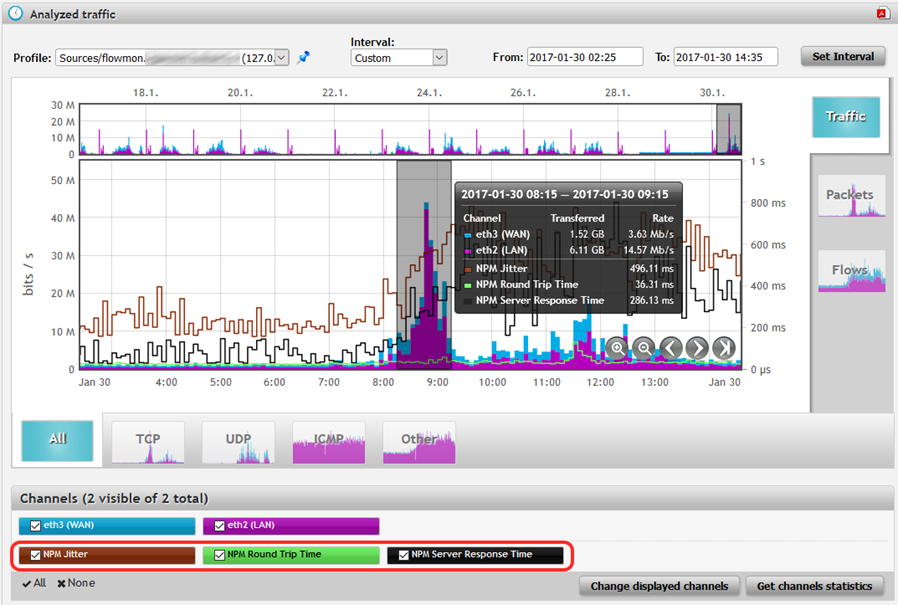
Network Performance Monitoring metrics tremendously helps admins to troubleshoot problems such as network performance degradation, slow server response, bad quality of VoIP traffic and much more. NPM metrics are now visualized in Analysis charts and available without the need of running a query over the flow data. Visualized metrics can help you get an at-a-glance insight into your network performance.
You can enable NPM metrics visualization (if you are monitoring it using Flowmon Probe) by clicking on “Change displayed channels” button in Analysis and then check “Display NPM statistics”. After that, you will see metrics RTT (Round Trip Time), SRT (Server Response Time) and Jitter statistics in a chart.
Figure 1: Network Performance Metrics visualization in Analysis charts provide at-a-glance insight into network performance.
Encrypted Flow Export
Traditionally, flow data is exported from various devices (routers, switches, firewalls or dedicated probes) in plaintext using the UDP protocol. This is not an issue when we export to the collector through private or secure networks. But when we want to export flow data through public or insecure networks, e.g. export from the customer side to a Cloud Service Provider through the Internet, we either need to use VPNs, tunnels, dedicated links or encryption to protect against unauthorized access to the information concerning all communications in the network - flow data.
Figure 2: Encrypted flow export from customer to Cloud Service Provider through public network.

The most feasible way is to =encrypt exported flow data , which is one of the new features in Flowmon 8.03. Together with encrypted flow forwarding, introduced in Flowmon 8.02 (more here), we have covered all the possibilities of transporting flows from one appliance to another in a reliable and secure way.
Figure 3: Encrypted flow export and forwarding using TCP and TLS protocols.

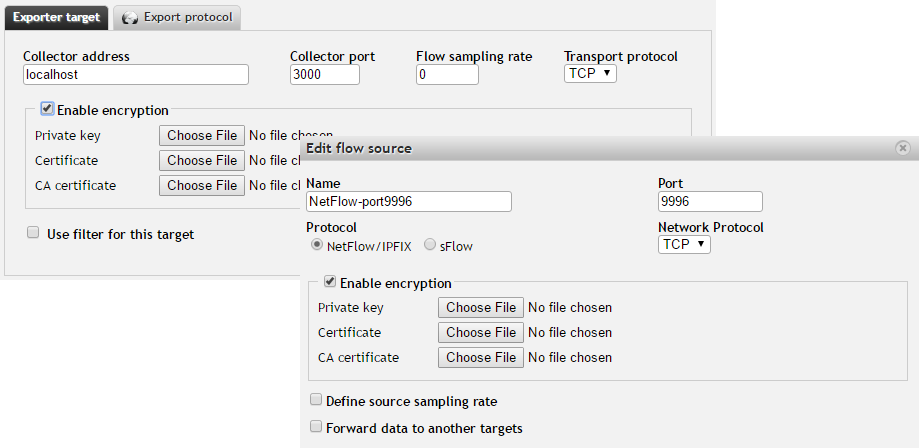
Encrypted flow export and forwarding use TCP for reliable and TLS for the secure transport of flow data . Both probes and collectors are RFC 5153 compliant and ready for the future when more devices will support this standard (eg. routers). Encrypted flow export can be configured in Flowmon Configuration Center. You need to configure both exporters and listening ports, and after choosing TCP as a transport protocol, you can enable encryption and add keys and certificates. A guide for generating keys and certificates is available on our support portal.
Figure 4: Exporter and listening port configuration.
Extended Application Layer Visibility
Flowmon 8.03 includes monitoring new application layer protocols – Microsoft SQL (TDS protocol) and e-mail traffic (SMTP, IMAP, POP3) and also improves visibility into the HTTP protocol.
- Microsoft SQL (TDS protocol) monitoring – information such as MSSQL usernames, hostnames, request type. Additionally, this can provide an insight into the database traffic and help you determine database utilization up to the level of each user.
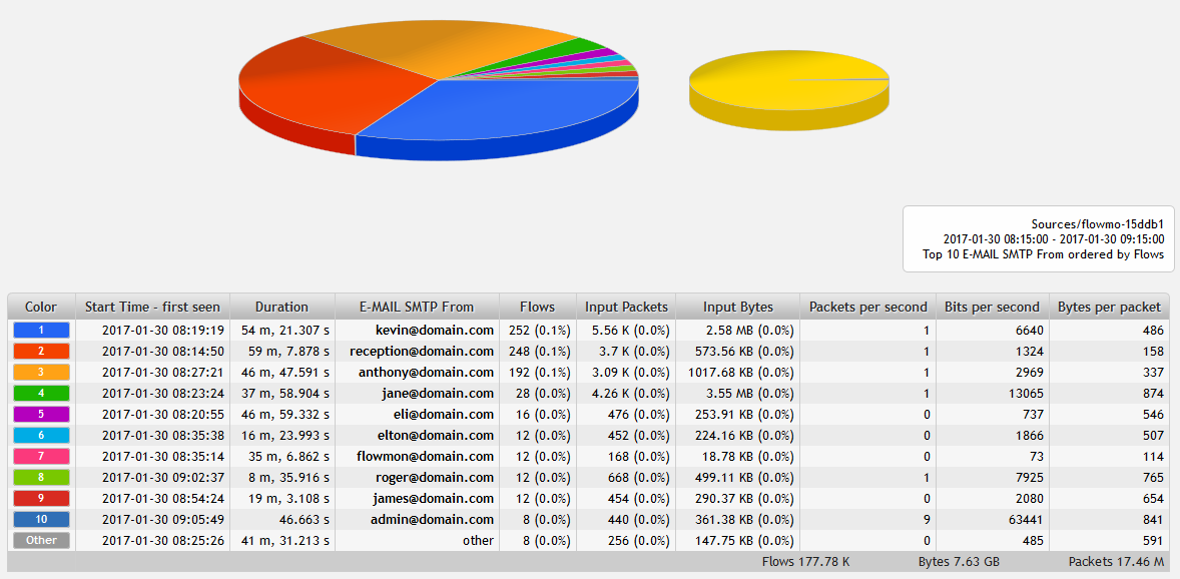
- E-mail traffic monitoring – monitoring SMTP, IMAP and POP3 protocol provides an insight about e-mail traffic such as top users who send the most emails or users who have failed to authenticate to the server and much more.
Figure 5: Top 10 e-mail senders statistic.
HTTP visibility was extended – HTTP information is now part of both request and response. Before 8.03, when a host got a response from the server, we would not see the HTTP information. Now you can see the HTTP information (such as hostname, URL) so it is possible to match specific requests to specific responses and see how many bytes were transferred. This improvement helps, for example, with measuring usage of cloud services .
We also monitor and collect additional HTTP information:
HTTP Method Type (GET, POST,...).
HTTP Status Codes.
This example shows the extended HTTP visibility . You can see HTTP hostname and URL as a part of the response together with HTTP method and result code.
Figure 6: Extended HTTP visibility - HTTP information in both requests and responses together with HTTP method and result code.

Other vendors proprietary IPFIX fields support
We extended support for IPFIX extensions of two other vendors – Gigamon and VMware.
Gigamon IPFIX enterprise extensions – besides support for traditional NetFlow v9 and IPFIX fields, we now also support HTTP and DNS information exported in IPFIX from Gigamon platform.
VMware NSX IPFIX extensions – by supporting this extension (eg. VM UUID) Flowmon provides an insight into traffic and communications in virtualized networks .
Check our support portal if you want to see a complete list of supported flow standards and extensions.
Interface and Work-Flow Improvements
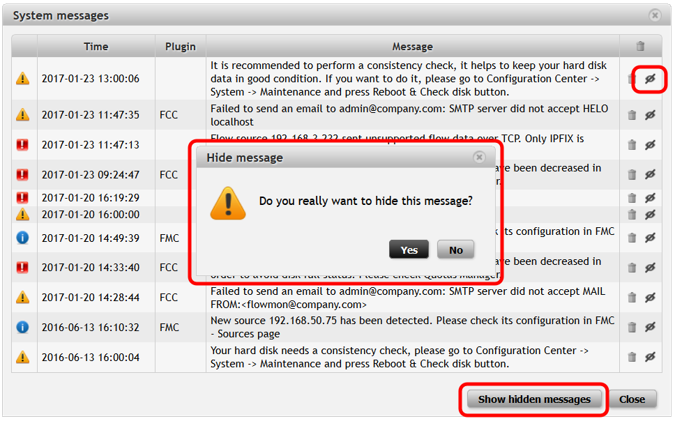
The new version brings several “Quality of Life” improvements to the GUI. The first is the option to hide system messages you do not want to be alerted about anymore. After clicking on the furthest most circle button on the left (next to the language settings) in the top right corner in our GUI, you will see a window with system messages. Messages can be hidden by clicking on the crossed-eye icon, and hidden messages can be shown again by clicking on “Show hidden messages”.
Figure 7: Option to hide system messages.
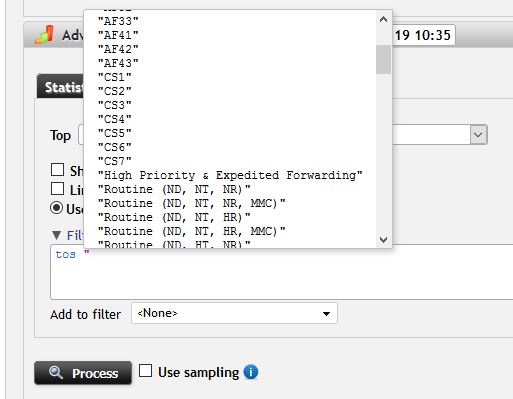
Another improvement is the option to filter network traffic using DSCP values (in addition to already available filtering using TOS values). Flowmon has an in-built dictionary so you can use DSCP Classes (cs1, cs2, af11, etc.) for filtering as well.
Figure 8: Filtering network traffic using DSCP values.
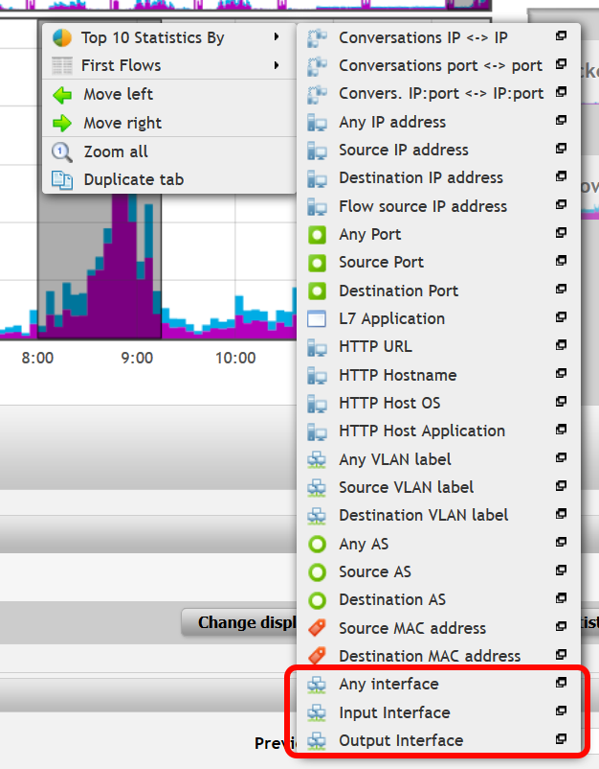
And the last QoL improvement is the new display of top n statistics in the context menu after clicking on a chart in Analysis. You can now find there “Any interface”, “Input interface” and “Output interface” top statistics, which are especially useful for the ISP segment of our customers.
Figure 9: Top n statistics added to context menu.
Which feature do you like the most? Let us know below in the comment section.
Until next time.