There once was a call center full of unhappy operators. Unhappy - they were in despair. The call status panel was refreshing at a snail rate of 5 seconds and more, making it hardly possible for them to meet their assigned quotas of sales calls.
This went on for so long that everyone, including the management, gave up trying to fix things, resigned to their fate, and accepted the misery as part of their life.
But the hard times weren’t to last forever
As the company grew, it gradually acquired several other companies and began consolidating the whole IT infrastructure, which, among other things, brought with it the need to address central monitoring. We had the privilege to be among the candidates for this task and were given a one-month PoC run. The network traffic statistics were processed by Flowmon ADS and Flowmon APM.
Besides issues with endpoint and server configuration, ADS discovered bottlenecks in the delivery chain. This happens every time you deploy a monitoring solution that observes every data flow and the behavior of every individual device. Because tools based on the mere collection of statistical information (e.g. SNMP) lack the necessary detail and the ability to correlate network statistics, they are by default unable to reveal such problems.
Five-second latency
But the biggest surprise came from APM with the web interface monitoring of the call center’s application running in the control center. Part of this involved monitoring the application’s SQL queries, which were generated upon every request from a client (i.e. an operator in the call center). It turned out that one particular part of the application (URL) showed a latency of 5 seconds and more for all operators.
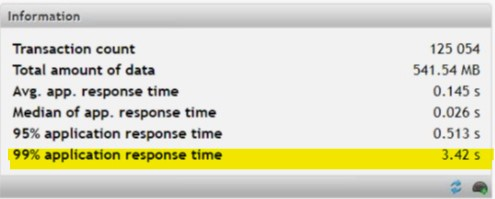
Here is an example of the lag measured by APM:
Fig. 1 Application health statistics

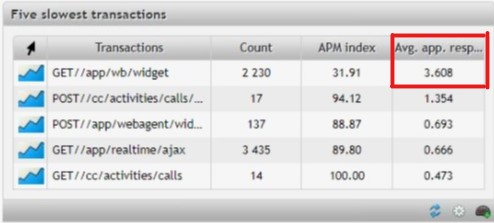
Fig. 2 Five URLs with the longest response time

Within a mere 20 minutes of measurement, the problem had already become clear. The 99th percentile response time showed a 3.42-second delay, which means that in 1 % of all user transactions it took the application server to process the request 3.42 seconds or longer. The data also showed that this involved one specific query; i.e. one particular component of the application.
Thousand times lag
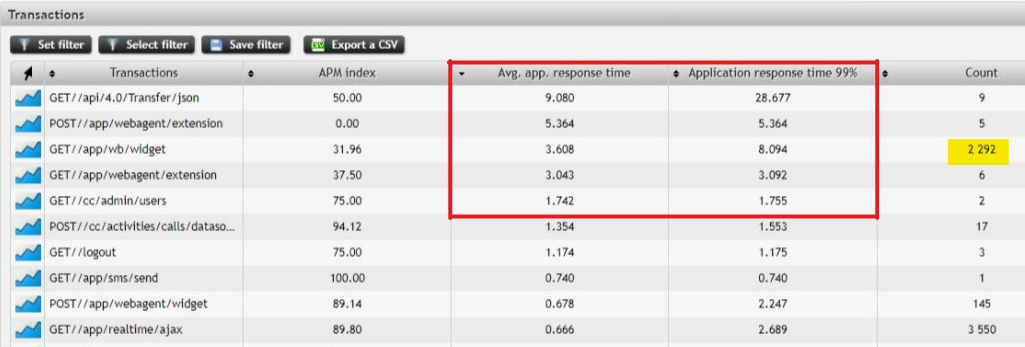
User transactions can be ranked in descending order by response time and the impact of the transactions on the overall user experience can be analyzed. Naturally, transactions that occur occasionally are less interesting and less impactful than transactions that count into the thousands.
Fig. 3 Detail of delays with the worst transactions at the top

The URL address //app/wb/widget saw 2,292 requests where on average it took 3.6s to process the request while the 99-percentile was over 8s. Another example of poor performance is the URL //app/realtime/ajax, which received 3,550 requests with average response time 0.66s and a 99-percentile of 2.7s . These numbers are nowhere near satisfactory in this day and age, where delays of as little as 1 second are enough to cause upset.
Problems are simple if you know where to look
All the findings collected throughout the PoC were summarized in a final report and allowed the call center’s admins and the application service provider to move in to resolve the issues.
But it’s not just about the latency figures, but also about the lesson. Problems aren’t always clear to see unless you know where to look. And luckily for this call center, it got just the right insight at just the right time.
Want to know more about how we monitor application performance? Let us know!