Although flow-based systems provide massive scalability, they lack packet level detail, while packet-based tools miss no detail, yet are expensive and hardly cope with today’s bandwidth explosion. By using a special purpose network device called a “Probe” we can get advantages of both for forensic analysis. Probe converts raw packets into accurate (non sampled) flow data enriched with information extracted from all the network layers and provides network performance metrics as well. Additionally, it enables full packet capture when needed and of what is needed. Simply put, the anomaly detection process starts with flow data being delivered and processed on the Collector side by an anomaly detection engine that provides out of the box detection of indicators of compromise, malicious activities, APTs, etc. The detection of malicious activity using flow data is a trigger to start capturing the packets to provide forensic evidence of the network activity.
Retrieve (almost) lost packets with rolling memory buffer
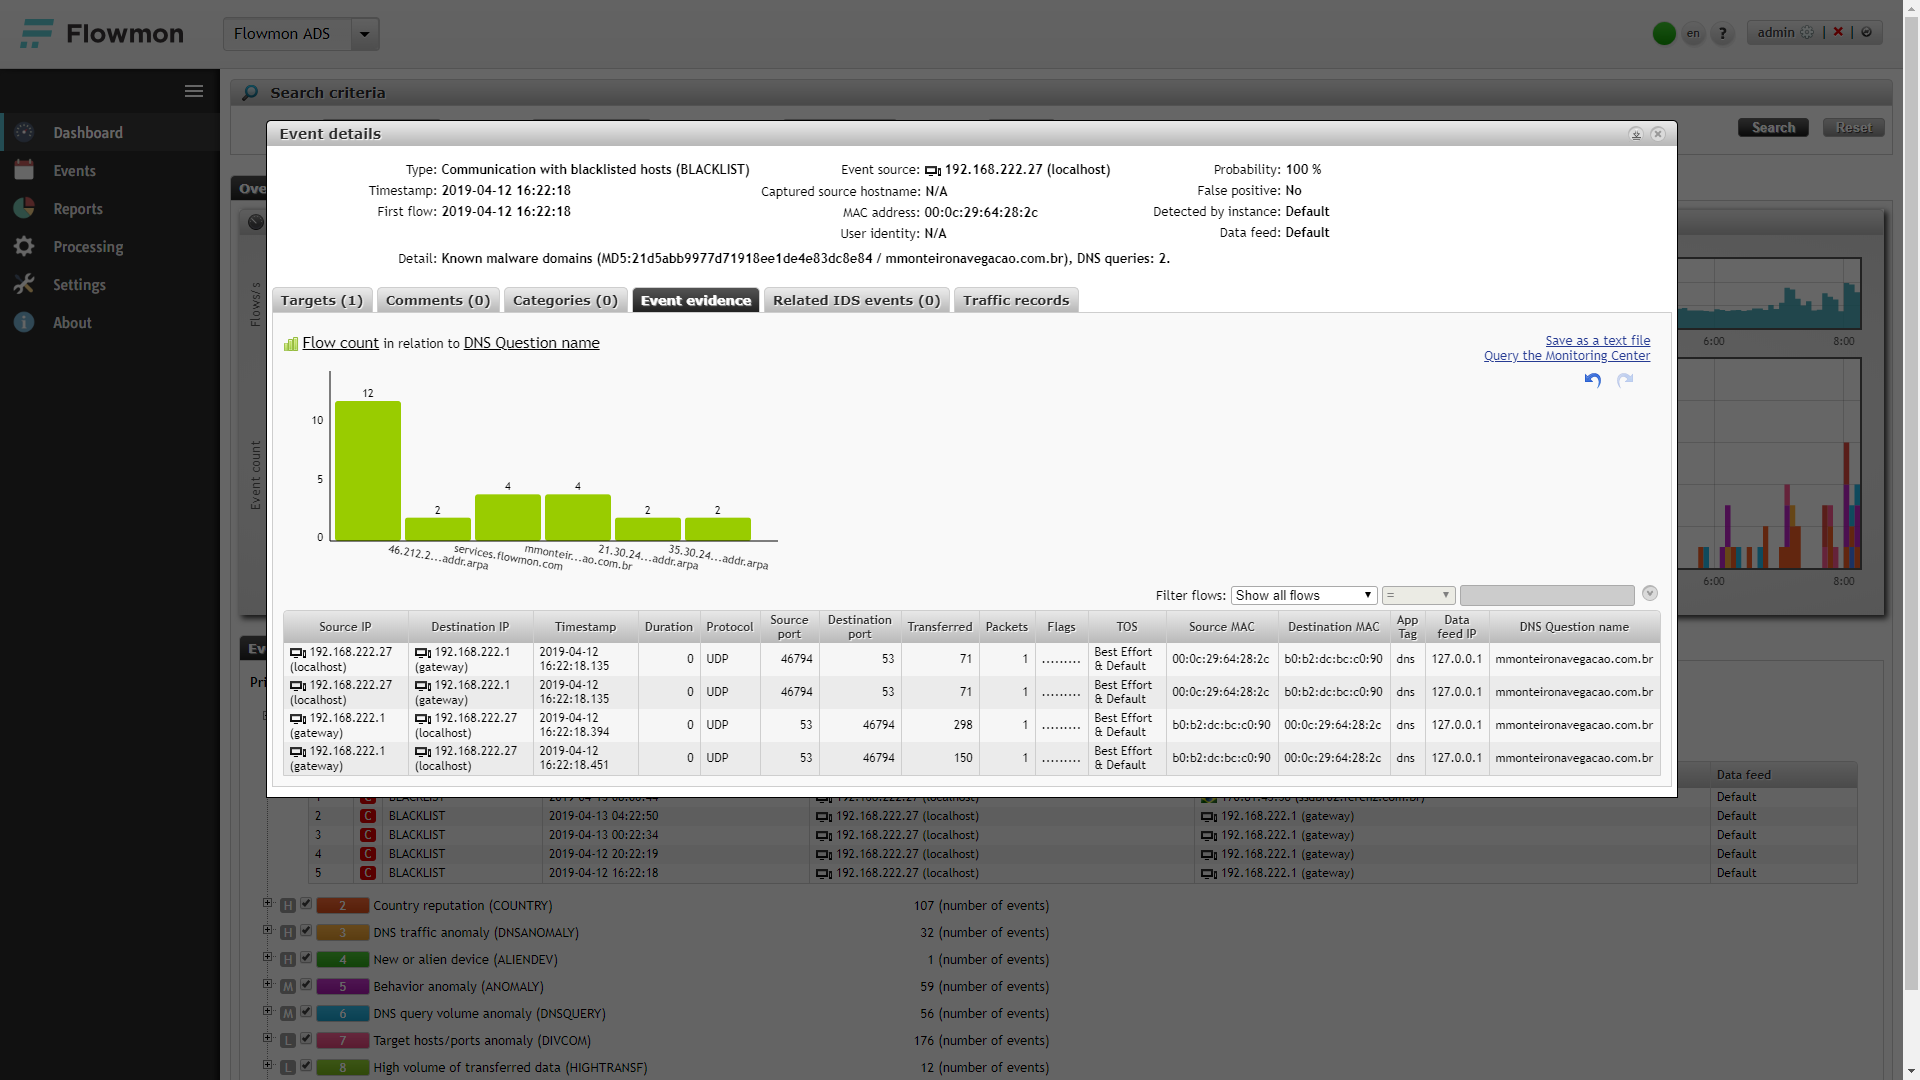
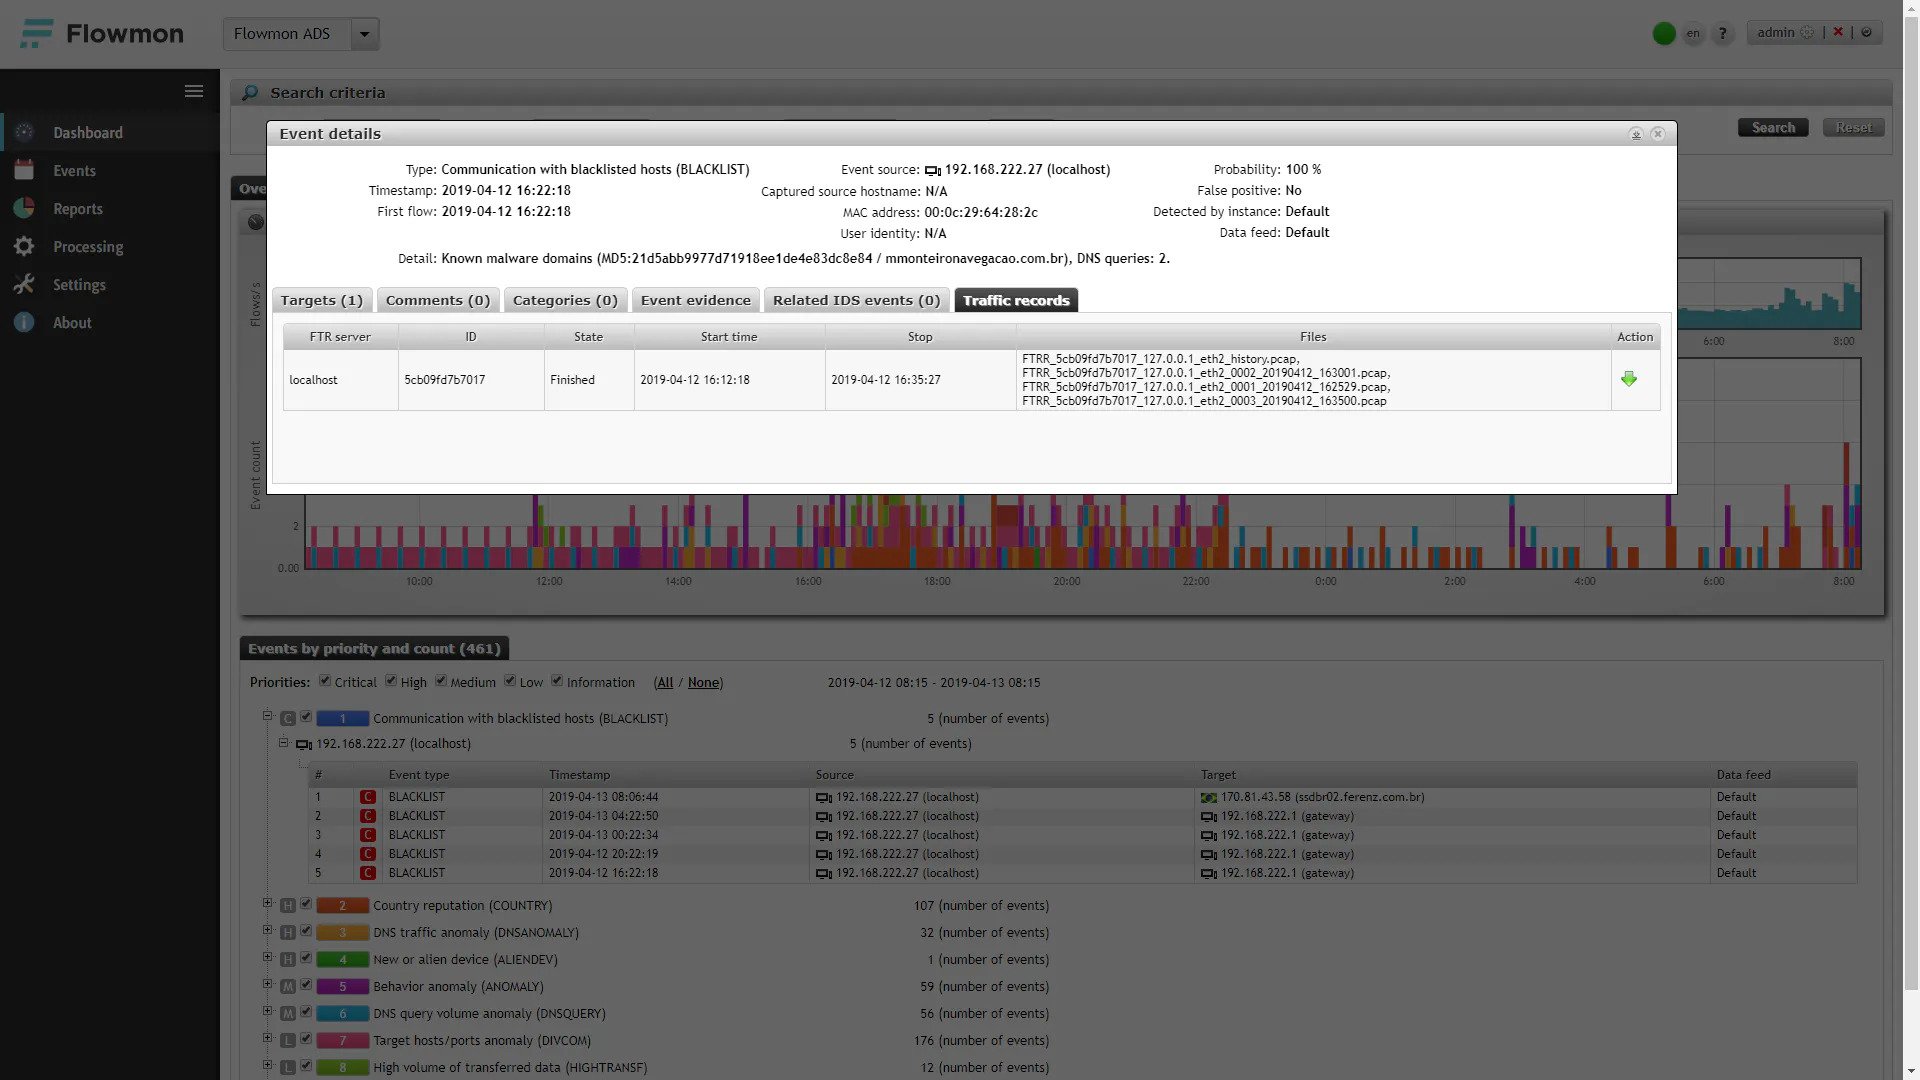
Sometimes we say “PCAP it or it didn’t happen”. So how can I get the packets of my interest as they have already gone and been converted to flows? The solution here is an elastic and intelligent memory buffer configured to keep in memory packets that might be needed to be captured for a limited time frame. The feature we are talking about is a rolling memory buffer introduced in Flowmon Traffic Recorder 10.0, combined with the triggered capture capability of Flowmon ADS. Let’s demonstrate the principle of the operation by using a simple scenario. I have detected and reported communication with a compromised site using Flowmon ADS. As part of the detection I have event details provided by Flowmon ADS, flow data from Flowmon Collector and full packet traces collected using Flowmon Traffic Recorder. Everything out of the box and collected automatically. One of the PCAP files is the “history” file that contains packets from the memory buffer of corresponding flow data that triggered the detection.
Figure 1 Event details showing a detected and reported DNS query to a malicious domain and providing flow data as event evidence. The device with IP address 192.168.222.27 asks for a DNS translation of a known domain related to malware distribution “mmonteironavegacao.com.br” using the DNS server 192.168.222.1.

Figure 2 All packet traces available for the event. The list of PCAPs includes a history file with full packet data from the memory buffer as well as real time captures of the device to record for subsequent activity. You can download a ZIP archive with all the PCAP files.

Figure 3 PCAP file with full DNS packet data opened in Wireshark for full visibility of the DNS queries and response data. A similar example is an anomaly detected and reported in email traffic (see Figure 4). Here it shows the use of an unexpected mail server to send emails. With full packet capture and rolling memory buffer capability you can provide full evidence of the email communication (this depends on encryption being used).

Figure 4 SMTP anomaly details and full packet trace providing packets that correspond to the reported mail communication. You can download PCAPs and open in Wireshark as in the previous example.

Flexible Configuration
The principle behind rolling memory buffer is an extension of flow cache to store the first N packets of each flow for a defined period of time. In a typical enterprise environment with 1Gbps of traffic you will need an approximately 2GB memory buffer allocation to keep the first 20 packets of each connection for 10 minutes. This is completely sufficient. The last 10 minutes is enough time to perform flow based detection and subsequently retrieve the packets from memory. Also, the first 20 packets are more than enough, as the most important part of the traffic is when sessions are being established. There is no need to store encrypted packets of, for example, Youtube video streams. The memory allocation, number of packets and history is fully configurable with continuous reporting on memory buffer utilisation. Also, the input traffic for the memory buffer can be pre-filtered and limited by a monitoring port or even a specific subnet.
Combination that pays off
The presented scenarios demonstrate the capability of a flow-based monitoring and anomaly detection system to provide full packet traces for forensic analysis. In a similar way packet capture can be used for daily network operation and troubleshooting. We have also demonstrated that a flow-based network monitoring system does not necessarily mean only L3/L4 visibility. Flow data enriched with L7 information, such as DNS query data and responses, provide much more visibility, enabling new troubleshooting and anomaly detection scenarios. The list of supported protocols for parsing and L7 information extraction for flow enrichment includes protocols such as HTTP, TLS/SSL, DHCP, Samba and many others, as well as ICS/SCADA protocols such as IEC 104, Goose, DLMS and MMS.
Download our whitepaper on Enriched Flow Data and its role in network operations to get additional information.