The encryption era is here and if you lack visibility into SSL/TLS communication in your traffic, you are only one step away from problems. Let’s illustrate the difference on a very basic network monitoring task - investigation on user traffic when dealing with bandwidth utilization task.
Imagine you want to know which applications, services are being used and how they contribute to the bandwidth consumption. We will examine this use case from three different perspectives limited by the capabilities of network monitoring systems. We will present all cases with the same network traffic statistics of a single IP address (user) in the network. To keep traffic statistics and examples short we always show only the top 10.
Basic Network Visibility (L3/L4)
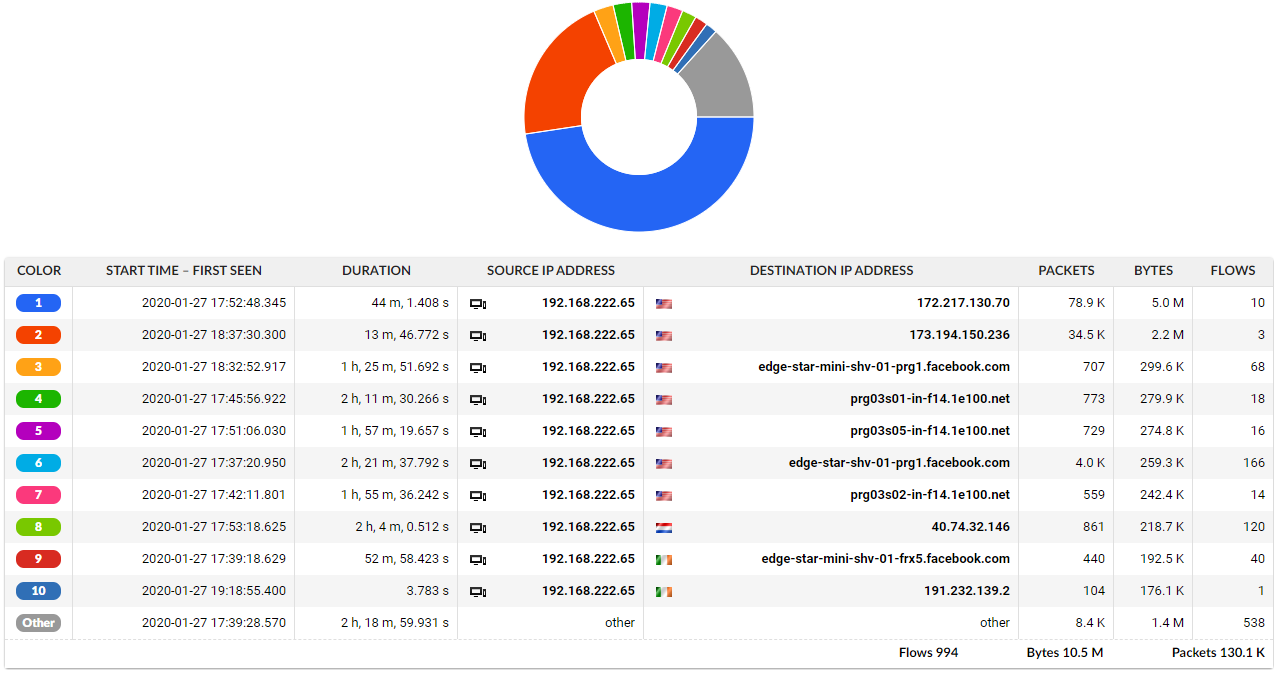
Network performance monitoring & diagnostic tools (NPMD) works with network telemetry called flow data. You can think of flow data as a list of phone calls. You know who is talking to whom, when and how long. You have no access to the call itself or metadata representing at least the topic of the call. What does it mean in network reality? You have L3/L4 information so your network telemetry includes IP address, ports, protocol, timestamps and amount of transferred data. IP addresses can be ex post converted to domain names to get a better understanding of its purpose. In the modern internet era, where content is delivered through CDN networks, IP addresses host various domains and from the IP address itself or domain name it is very difficult to understand the user traffic. So what you get is pretty limited picture of the network traffic and your visibility ends on IP and transport layer.
Figure 1: Example of specific user traffic analysis based on traditional flow data without any application layer visibility or ETA.

Anyway, this view provides the visibility sufficient to observe the structure of the traffic which is handy in case of capacity planning (to see what IPs are utilising the bandwidth). However, troubleshooting is not that easy without identification of the actual service or application involved and we need to refer to some sort of external asset management or knowledge base.
Network Visibility Enriched with Application Data
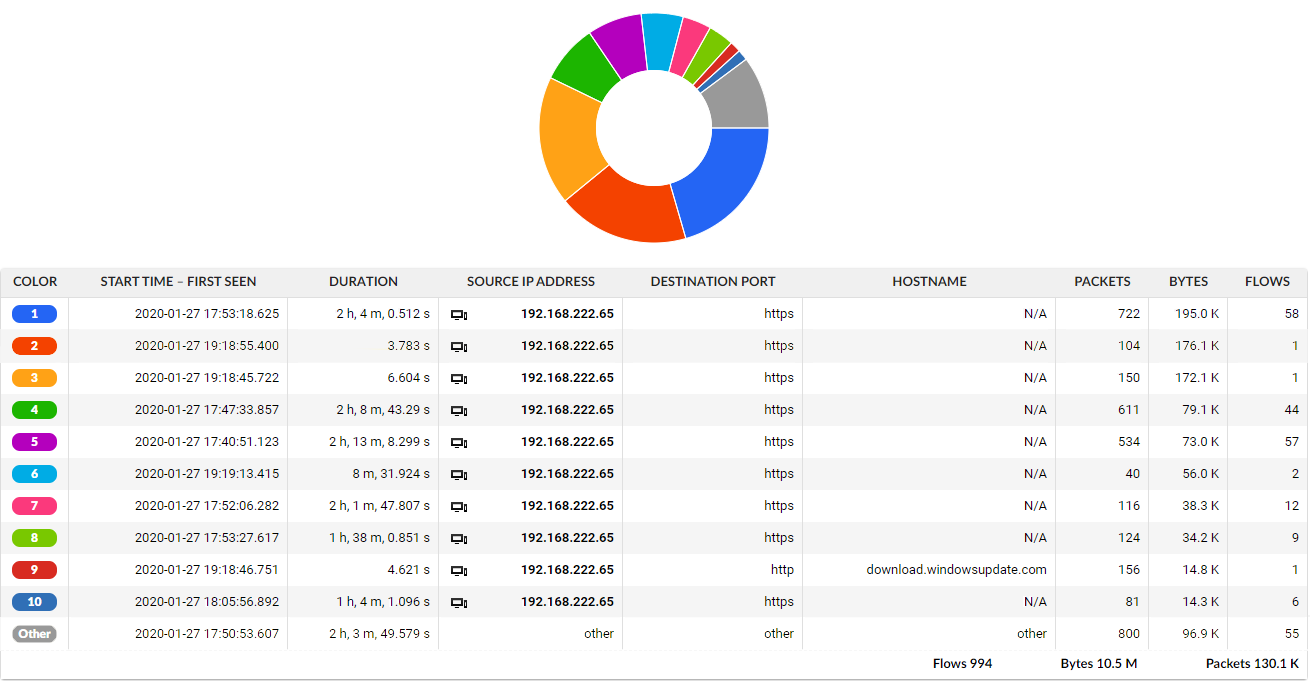
Modern flow-based systems dig deeper. As an extension of basic flow records, they provide optional extraction of specific application metadata and report them usually in IPFIX format. If we go back to our phone call analogy it is like having the list extended by topics of individual calls. In our bandwidth utilization use case, we are interested in what websites have been accessed by a specific user. Modern network traffic monitoring systems are able to recognize HTTP requests, extract metadata such as HTTP hostname and provide them in seamless analysis together with existing L3/L4 information. With such enriched flow data records we get a more holistic view, regardless it is an in-house or some SaaS. Thus we can decide whether the traffic is legitimate or not, if it is necessary to block it or limit somehow.
However, this is only available for non encrypted traffic. In situations when the most traffic is already encrypted (80% of the web traffic according to Gartner), such visibility is no longer available. So again what you end up with is a very limited view that provides metadata only from unencrypted traffic.
Figure 2: Example of specific user traffic analysis based on extended flow data by application layer visibility into unencrypted HTTP traffic.

Network Visibility Strengthened with SSL/TLS Visibility
The most advanced flow-based systems provide the ability to extract various metadata from encrypted traffic without invading user privacy by decrypting the traffic or introducing man in the middle techniques. This additional metadata is again reported as extended flow records usually in IPFIX format. In our phone call analogy it means that we still have topics for individual calls even if the conversation itself is encrypted.
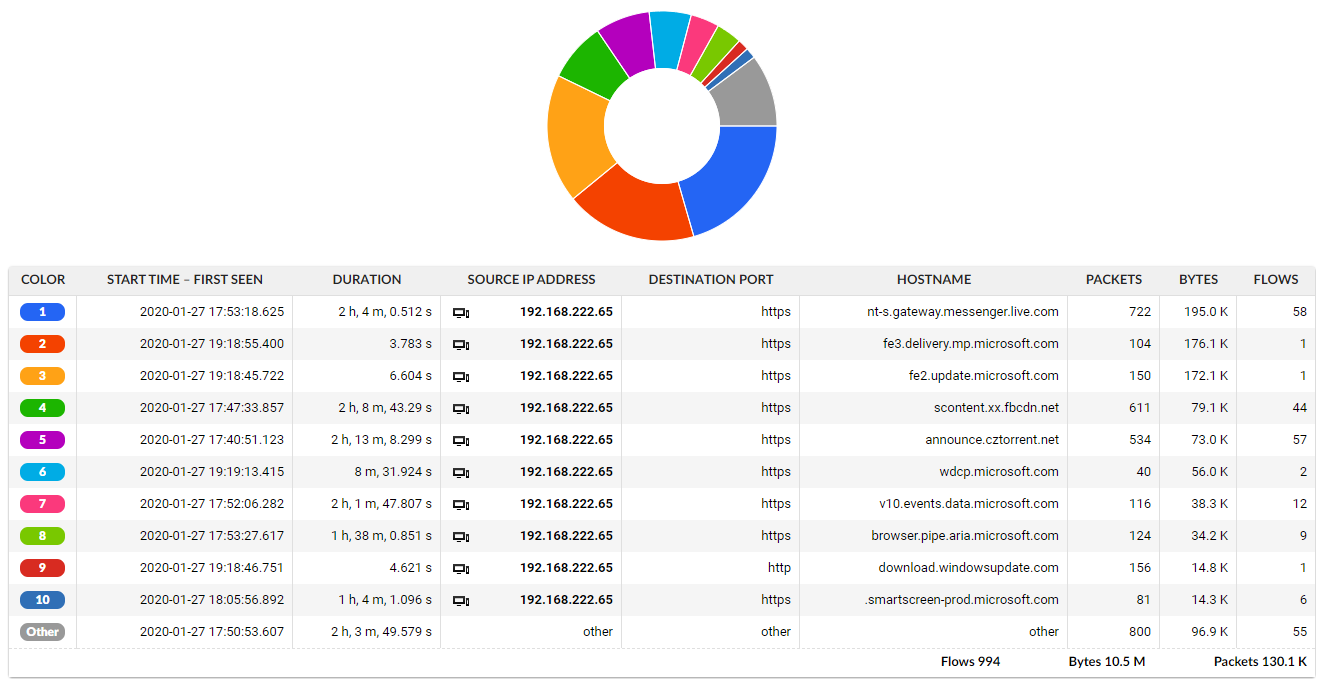
The reason behind this is that monitoring systems are able to identify and track when encrypted sessions are being established and extract metadata from these sessions while still not interfering with the content itself. So even if traffic is encrypted we are able to present HTTP hostnames that correspond to server name indication from encryption certificates. Now we are able to track all the traffic on L3/L4 (IP address) level extended by host names for encrypted as well as plain text traffic in single view.
Figure 3: Example of specific user traffic analysis based on extended flow data with ETA providing visibility into encrypted traffic as well.

Encrypted traffic analysis extends the level of visibility shown above even to HTTPS. The additional level of application visibility enables users to get a holistic view on the network traffic sufficient for full troubleshooting of undesired bandwidth consumption, even if the connections are encrypted.
ETA Has much More to Offer
We’ve illustrated the importance of ETA on a very basic network monitoring task. It is clear that to preserve efficiency of network operations in the encrypted era, insight into SSL/TLS communication is a must. When more and more ingoing and outgoing traffic is being encrypted, ETA represents a very lightweight, passive and cost-efficient technology for keeping your network operations as efficient as you use to in a non-encrypted world.
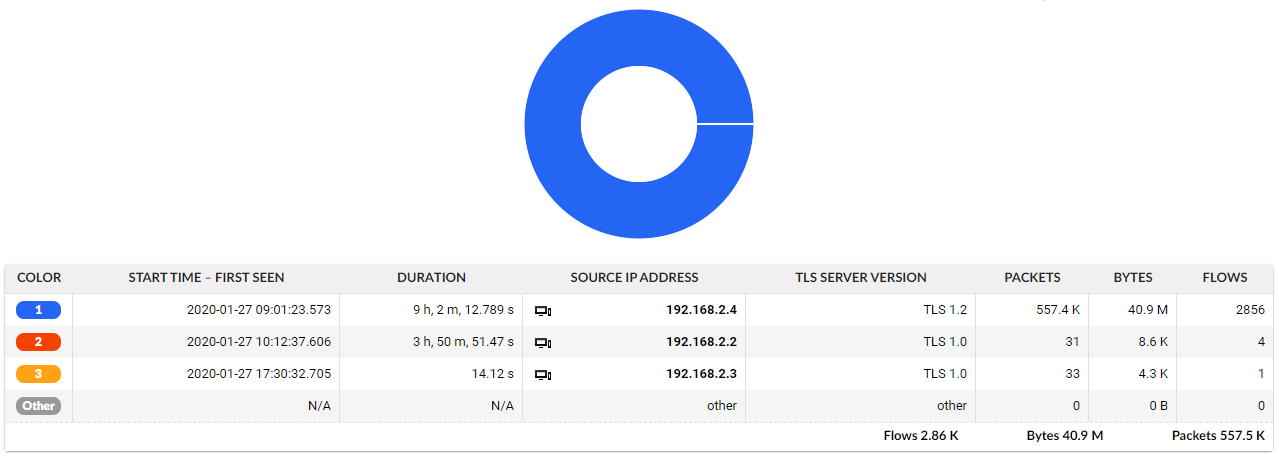
In fact, this technology has much more to offer. Administrators in large network environments can easily validate on compliance with cryptographic standards. So reporting on servers still using deprecated (and insecure) encryption algorithms can be an automated task. Same applies for validation of certificates or fingerprinting individual clients with respect to encryption techniques they speak to the outside world.
Figure 4: Report on servers from company DMZ and TLS version they speak, you can notice one server using TLS 1.2 which is considered as secure. This does not apply to TLS 1.0 which is considered as unsecure and should not be used any longer.
