The Simple Network Management Protocol (SNMP) is used for collecting data from network devices. An agent running on a managed device reports the requested information via SNMP to the manager. The information requested is described in MIB files. MIB (Management Information Base) is a database with a hierarchical structure where each entry is addressed through an object identifier (OID).
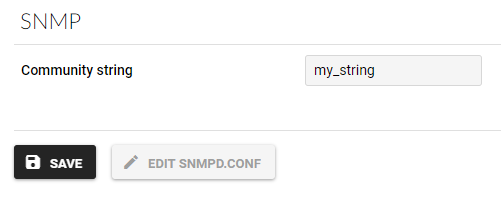
The SNMP Community string, which can be set in Flowmon under Configuration Center/System/System settings/SNMP, is a simple authentication mechanism. It is used as an authentication in SNMPv2, but it is not very secure, because it is sent with every packet in plain text. To use a more secure SNMPv3, read our blog about Secure monitoring of Flowmon resources.
Configuration:To configure Flowmon SNMP, just set the SNMP community string and you can then start using it to monitor system resources.

When the Community string is saved, to test the functionality use snmpwalk or snmpget command such assnmpwalk -v 1 -c [your community string] [IP address of monitored device] [Object Name or OID] :[flowmon@int-probe ~]$ snmpwalk -v 1 -c my_string localhost system
Below are listed some interesting Object names or OIDs that can be requested from agents.
- hrSystemNumUsers (1.3.6.1.2.1.25.1.5) - number of signed-in users
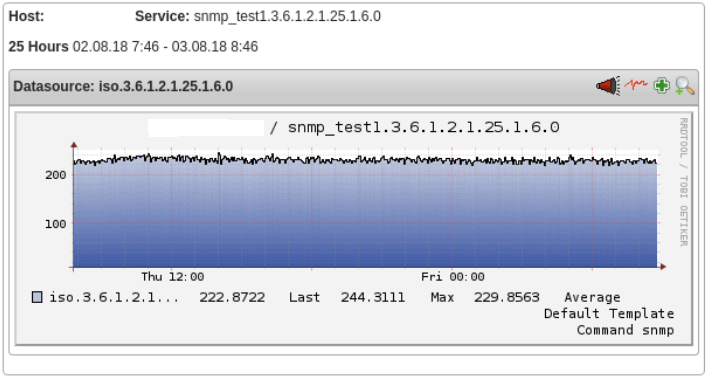
- hrSystemProcesses (1.3.6.1.2.1.25.1.6) - number of active processes
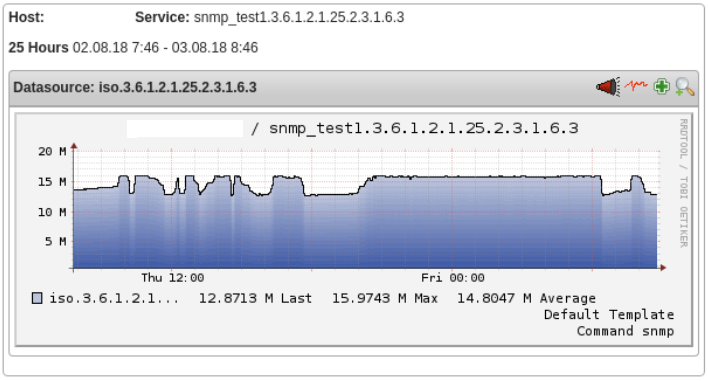
- hrDiskStorageCapacity (1.3.6.1.2.1.25.3.6.1.4) - storage capacity
- hrMemorySize (1.3.6.1.2.1.25.2.2) - memory size
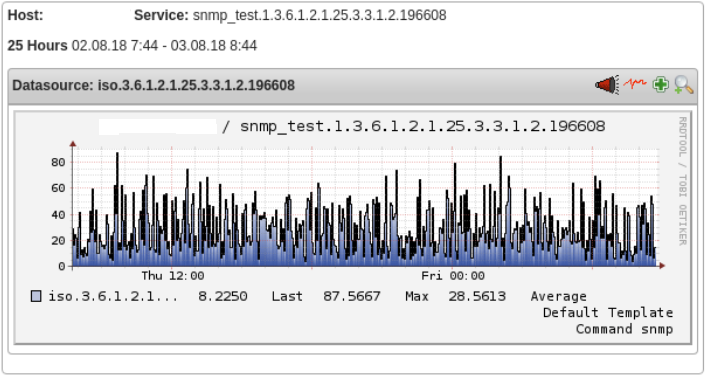
- hrProcessorLoad (1.3.6.1.2.1.25.3.3.1.2) - current load of processor
The full list of supported object names and OID’s is available on our portal.
With these MIB databases, there is no need to install monitoring clients that use other techniques, because Flowmon can provide the usage of the system and other Flowmon specific values via SNMP. To collect and analyse this data, only basic monitoring tools are needed (such as Nagios, Cacti, Icinga or Paessler PRTG). Here are some examples of monitoring Flowmon in Icinga.
A graph of System processes during the previous day:

A graph of Storage used during the previous day:

A graph of Processor load during the previous day:
