In this follow up blog post we will guide you through the one-time process of configuring both Flowmon and WhatsUp Gold to provide a single pane of glass into the digital environment of a sample company application.
Topology overview
Let’s start with a reminder of our application topology and related IP address plan. We do have a load balancer (Progress LoadMaster) that delivers the application workload MyApp (sometimes referred to as VirtualService in LoadMaster terminology) and serves as a sole entry point for all the clients. The application as such is hosted on a pair of servers RealServer23 and RealServer24 that are shielded by the load balancer.
Figure 1: MyApp topology and IP address plan.
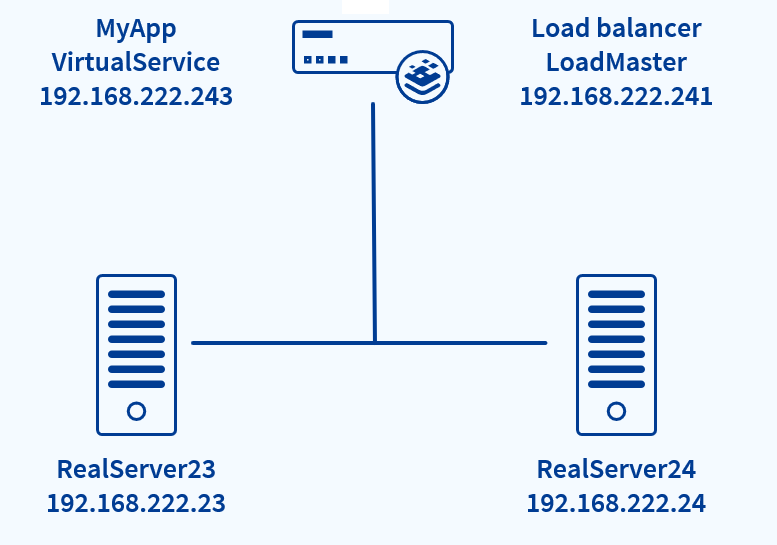
LoadMaster serves us in this case as a source of the network telemetry (IPFIX) traffic statistics and exports these statistics to Flowmon Collector. Alternatively, we could use a standalone Flowmon Probe to monitor the network traffic if needed. The purpose of WhatsUp Gold is to poll metrics from the pair of real servers and connect everything together on a single dashboard.
Flowmon configuration
Let’s start with the configuration on Flowmon side. We need to define specific views into the network traffic so Flowmon can in the background filter the telemetry relevant for inpidual application components, aggregate the telemetry into time series data and provide meaningful metrics in the form of traffic charts. In the Flowmon terminology we will create profiles. For more information about profiles check this video tutorial.
Figure 2: Profile for RealServer24 with a single channel called “RealServer24”. The channel is defined by filter (ip 192.168.222.24) that identifies all traffic subject of processing within a given channel. Alternatively, a more specific definition can be used to include the port where the application is running and limit the traffic to LoadMaster only (ip 192.168.222.24 and ip 192.168.222.241 and port 80). The proper filter always depends on the application specific environment and IP address plan.
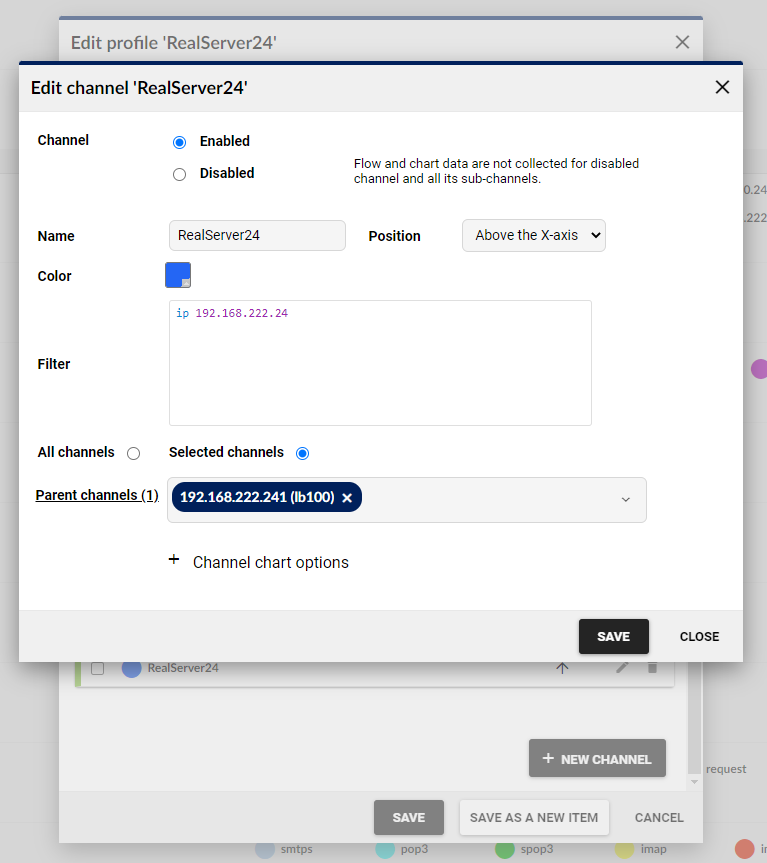
In a similar way the profile for RealServer23 can be created. Or a profile composed of multiple channels stitching together traffic of inpidual real servers and MyApp client traffic as such. WhatsUp Gold can retrieve the data from inpidual profiles therefore you need to consider which profiles you need to properly represent volumetric and performance metrics of inpidual application components. The general recommendation is to create a profile with a single channel per application component and another profile stitching all the traffic together where inpidual application components will be represented as inpidual channels within the profile.
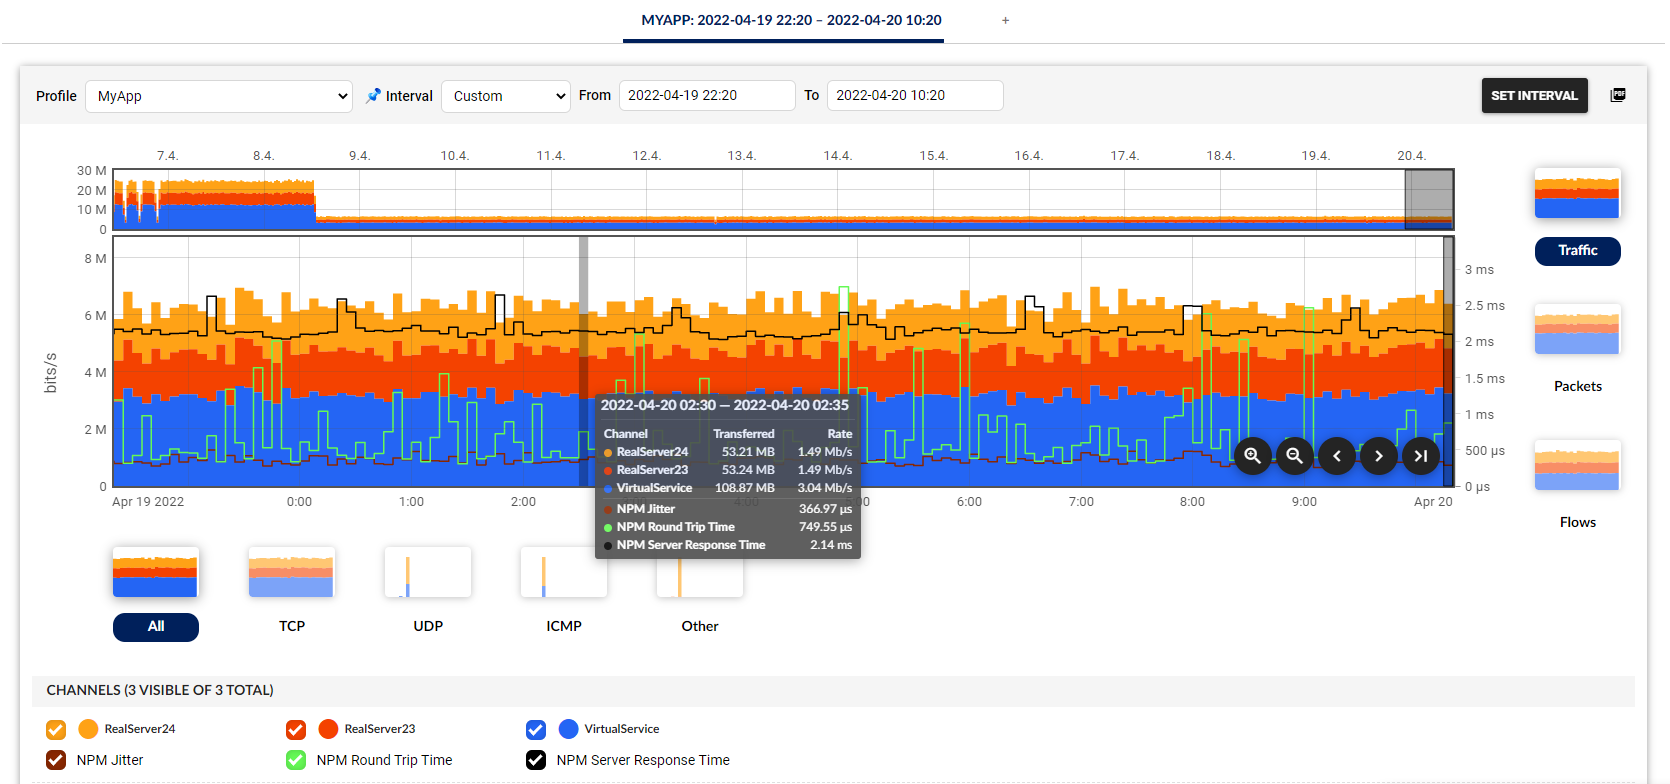
Figure 3: Profile for the whole MyApp composed of three different channel. Channel VirtualService (ip 192.168.222.243) represents how users are interacting with the application through the load balancer and channels for servers RealServer23 and RealServer24 represent the backend side between load balancer and real servers serving the application traffic. Bandwidth utilization for inpidual application components is available as well as aggregated performance metrics across all the displayed channels. Just keep in mind that we are still on Flowmon side and this is how Flowmon represents the data.
WhatsUp Gold configuration
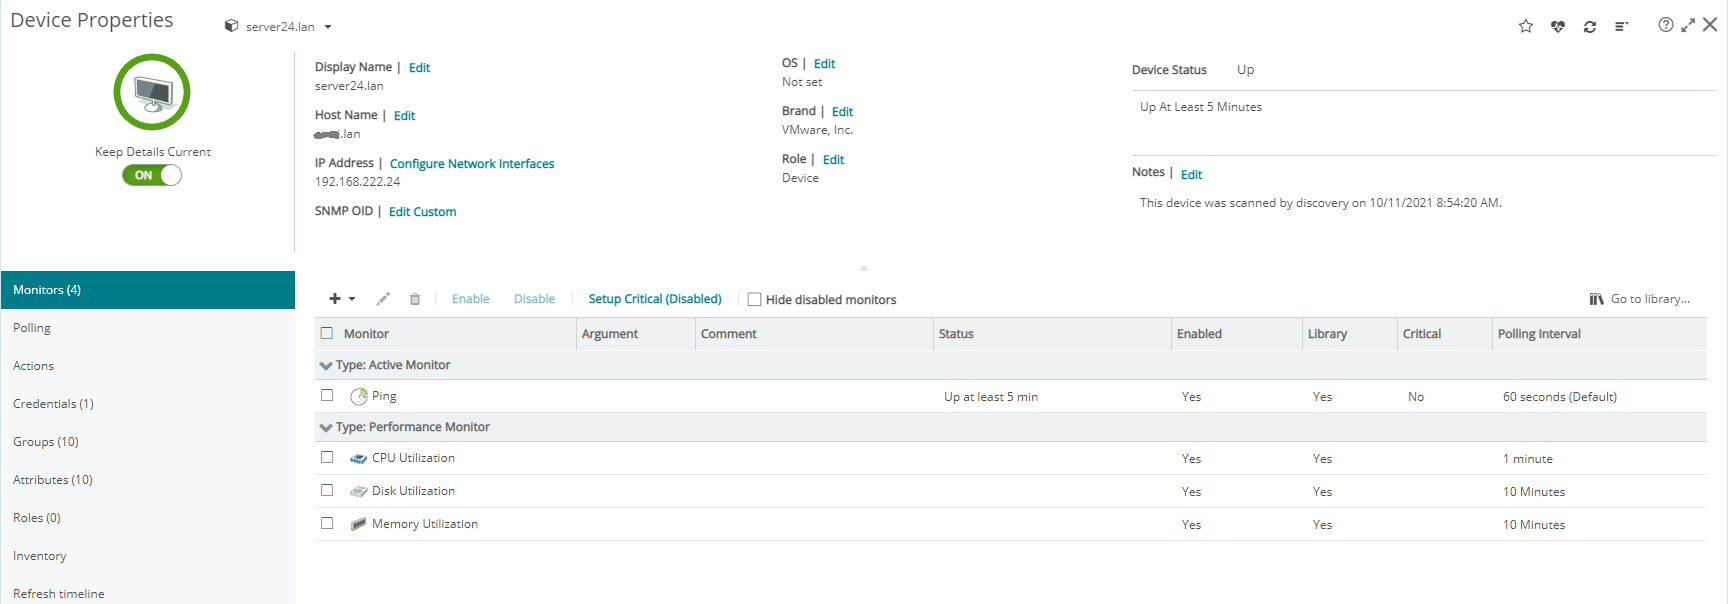
On the WhatsUp Gold side, the first step is the proper discovery of inpidual servers. The discovery process will recognize inpidual devices and their roles in the network and automatically configure active and performance monitors to report on device availability and poll key performance metrics such as CPU utilization or memory consumption.
Figure 4: Detail of RealServer24 in WhatsUp Gold with active monitor based on ”ping” and performance monitors polling CPU, memory and disk utilization.
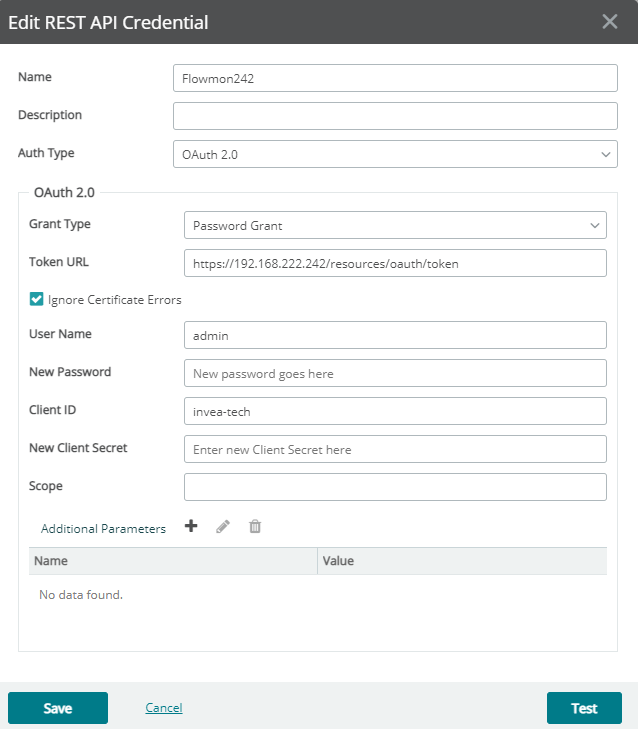
Now let's stitch everything together on the WhatsUp Gold dashboard dedicated to MyApp. Connection to Flowmon requires configuring specific REST API credentials to retrieve data from the Flowmon appliance. In Settings > Libraries > Credentials create new REST API Credentials specific to your Flowmon appliance.
Figure 5: Flowmon REST API credentials. Token URL requires proper IP address or host name corresponding to your Flowmon deployment as well as login and password. No client secret is required. Client ID needs to be configured to “invea-tech” and authentication type is “OAuth 2.0”. If you are using a self-signed certificate on Flowmon side you need to enable “Ignore Certificate Errors”. However, proper security practice mandates to generate and use a trusted certificate through certification authority.
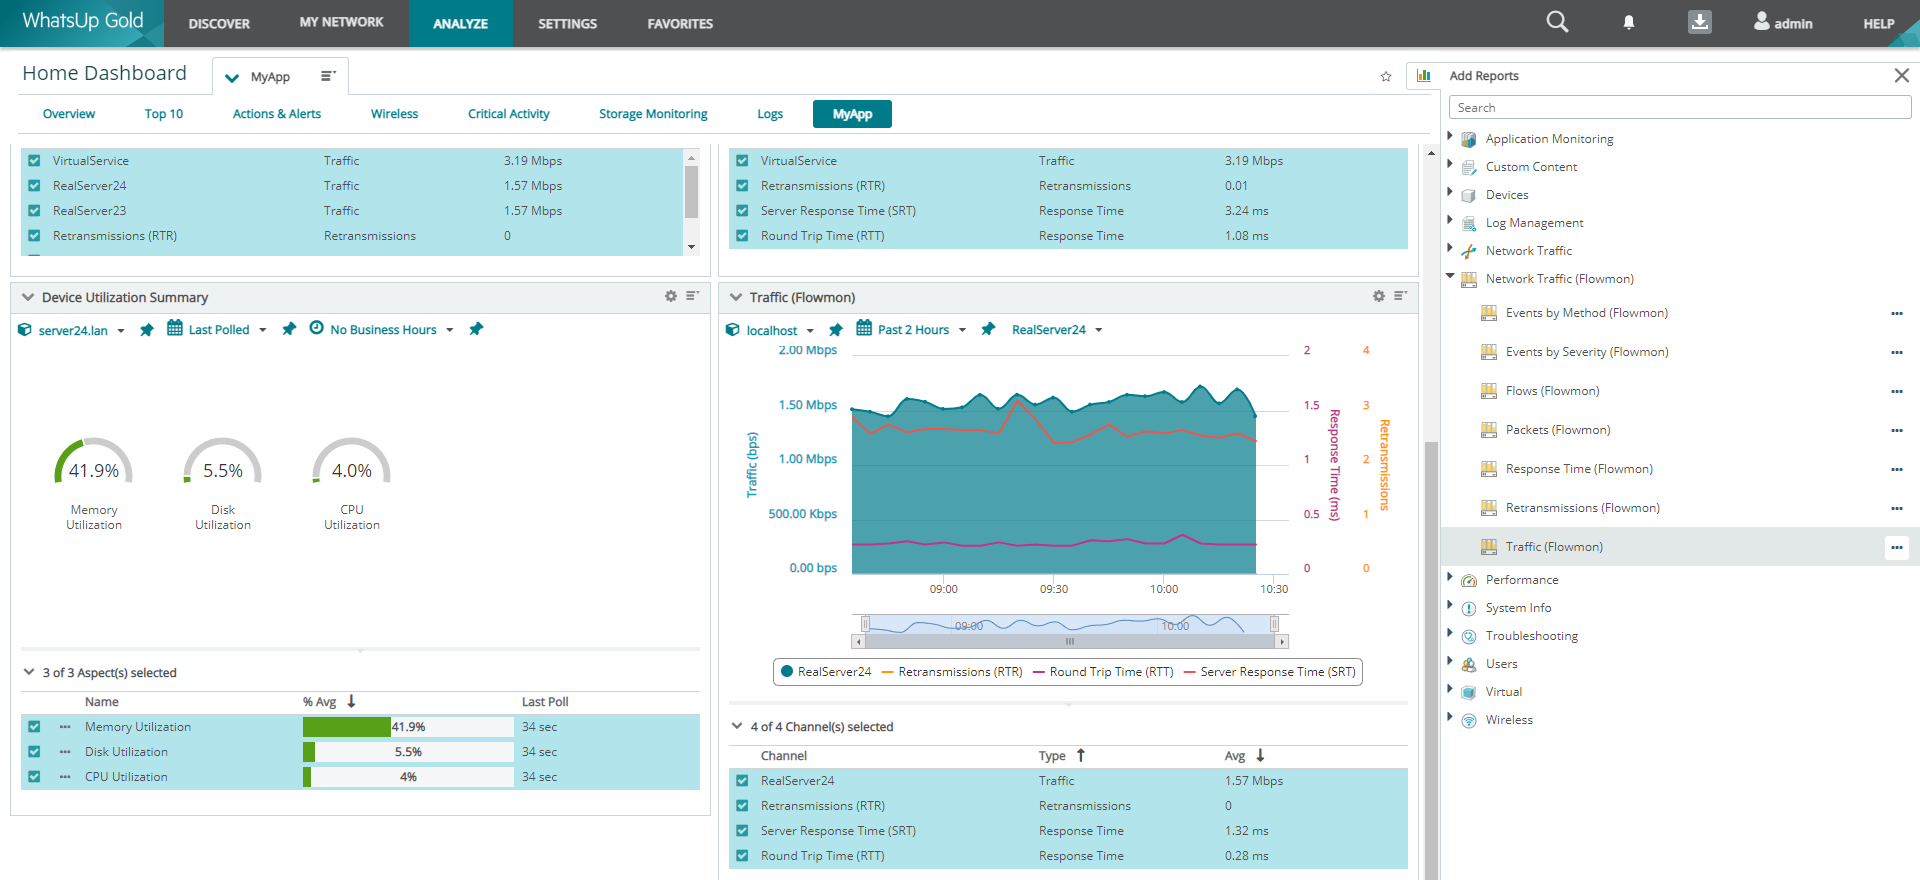
Do not forget to assign these particular credentials to your Flowmon device in Device Properties > Credentials. Now everything is ready to create a new dashboard tab for MyApp and include widgets to provide comprehensive visibility into the application traffic and status of inpidual servers. The goal is to combine the Traffic (Flowmon) widget type to show metrics of inpidual application components together with performance overview widgets showing the data originating from WhatsUp Gold to achieve single pane of glass.
Figure 6: New dashboard tab composed of multiple instances of Traffic (Flowmon) widgets polling data from previously created Profiles in Flowmon combined with Device Utilization Summary widgets for inpidual servers. Placing the widgets next to each other will show at first sight correlation between network performance metrics and device utilization.
Summary
We have demonstrated how to build a consolidated view leveraging both data from IT infrastructure monitoring (WhatsUp Gold) and Network Performance Monitoring & Diagnostics (Flowmon). Single pane of glass showing all relevant metrics and telemetry helps to connect the dots and discover the root cause of application experience issues.
Here at Progress we are on a mission to redefine Application eXperience and provide IT professionals with tools that will give them back control of the whole digital environment. The presented capability is based on WhatsUp Gold version 2022.0 that provides out of the box integration with Flowmon to gather and present volumetric and performance metrics as well as security events using Flowmon’s native REST API and is available to all WhatsUp Gold and Flowmon users. Flowmon version 11.1.x or 12.x is required. For security events Flowmon ADS version 11.4.x or 12.x is required.
