If you want to respond to network issues quickly and promptly, you can’t waste time digging for information. So how can Flowmon 11.1 help?
Shareable dashboards
Topology visualization
Improved flow source live check
REST API documentation in Swagger UI
Share your dashboards
Sharing is caring. And, it saves time - you now have the ability to save your custom dashboards and add them to the list of predefined system dashboards so that others, whether your customers or other users within your organization, can then choose and apply them without having to set up anything themselves.
Figure 1 ‘Edit dashboard’ dialog showing the sharing status
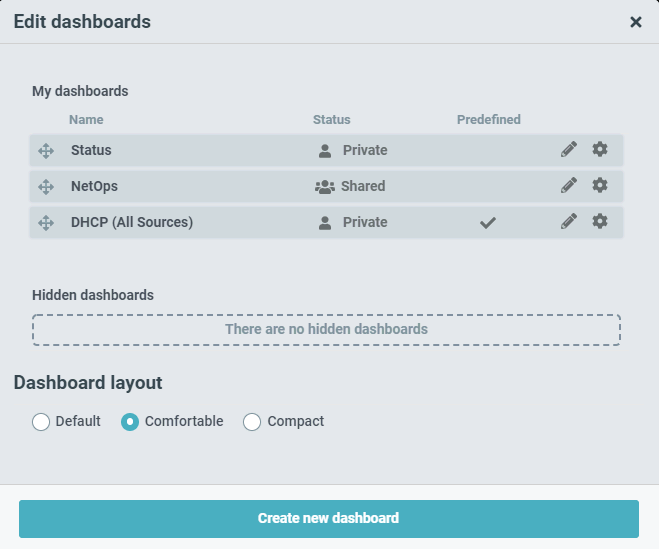
This is a great way to speed up the configuration of the Flowmon solution or simply to share your way of using the system with others.
As an extension, you can also set up shared dashboards that are identical for everyone using them. Everyone sees what you see, and if you make a change to your parent dashboard, it will automatically appear to the others, too. What a way to foster team cohesion!
This is especially useful in the following scenarios:
You are onboarding a new IT team member who can start with fully populated dashboards instead of figuring out what is available and spending time adjusting everything.
You are an MSP provisioning Flowmon, in which case you can prepare, share, and manage views as the administrator for your customers (individual tenants).
See the whole topology
The information value of status dashboards has now received a great addition in the form of topology visualization.
Figure 2 Map view
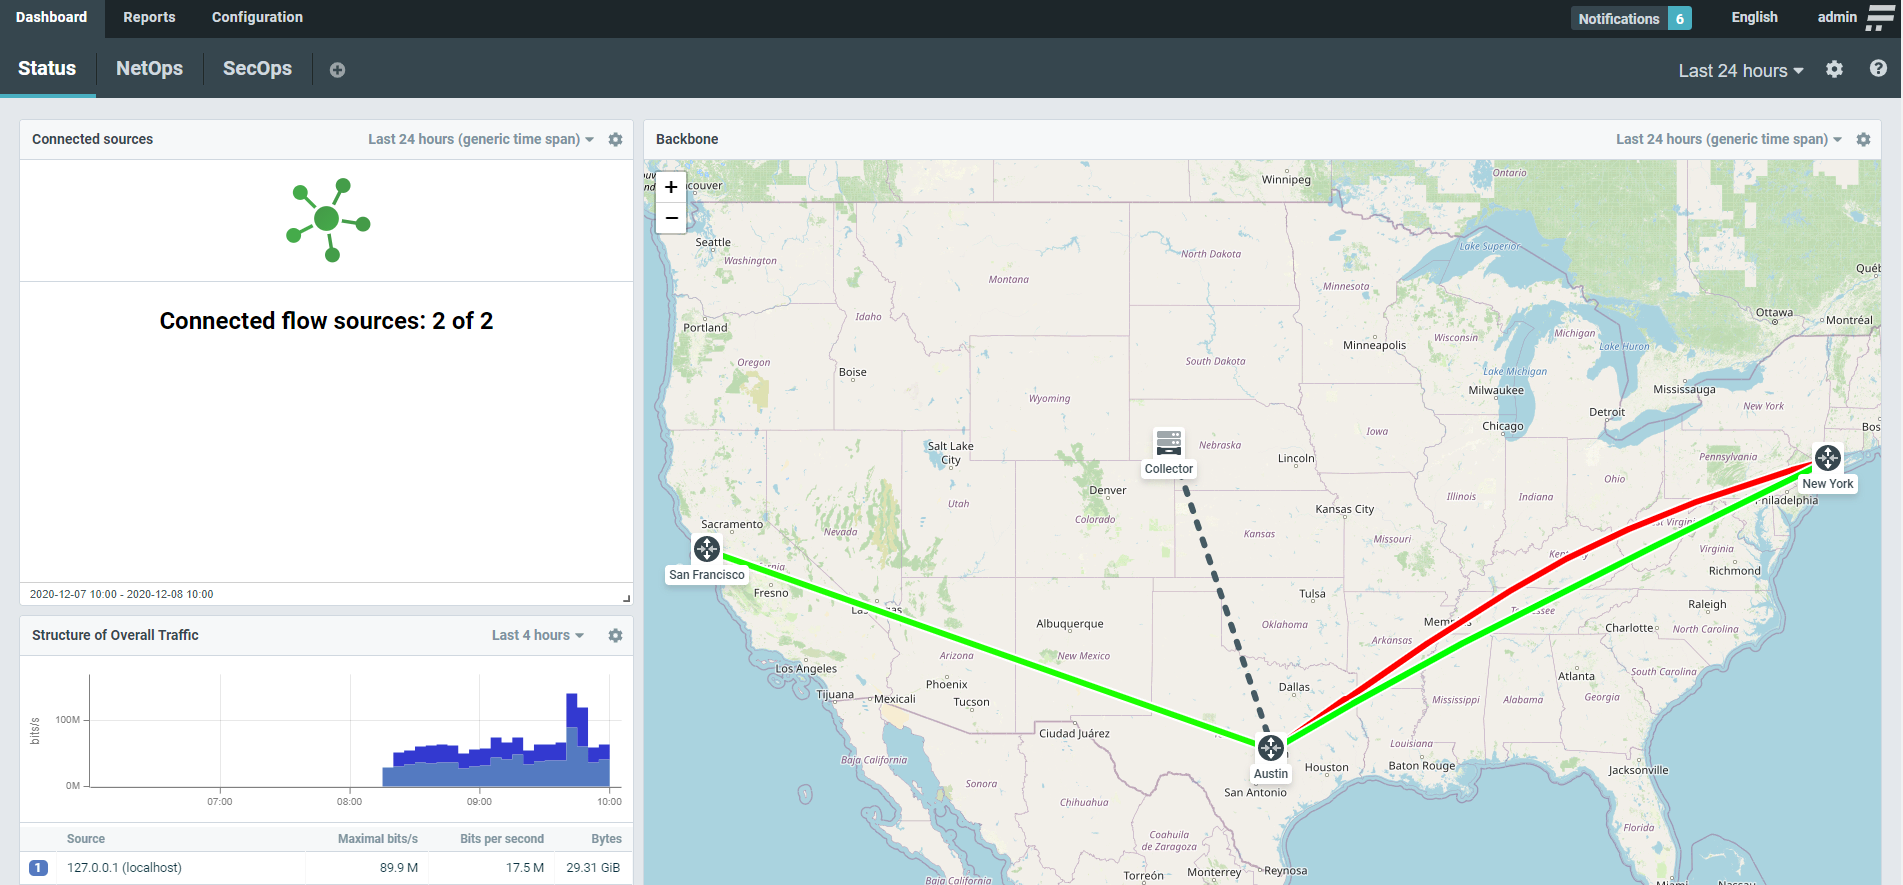
Nodes represent routers, switches, or other appliances, which can be connected by links to show their utilization as a green-to-red heatmap.
You can configure multiple parameters, such as the method of calculation (average or 95-percentile), the profile that the link will represent, or the traffic scale middle point (i.e., the sensitivity of the link’s heatmap).
Figure 3 NetOps dashboard with a topological graph visualization
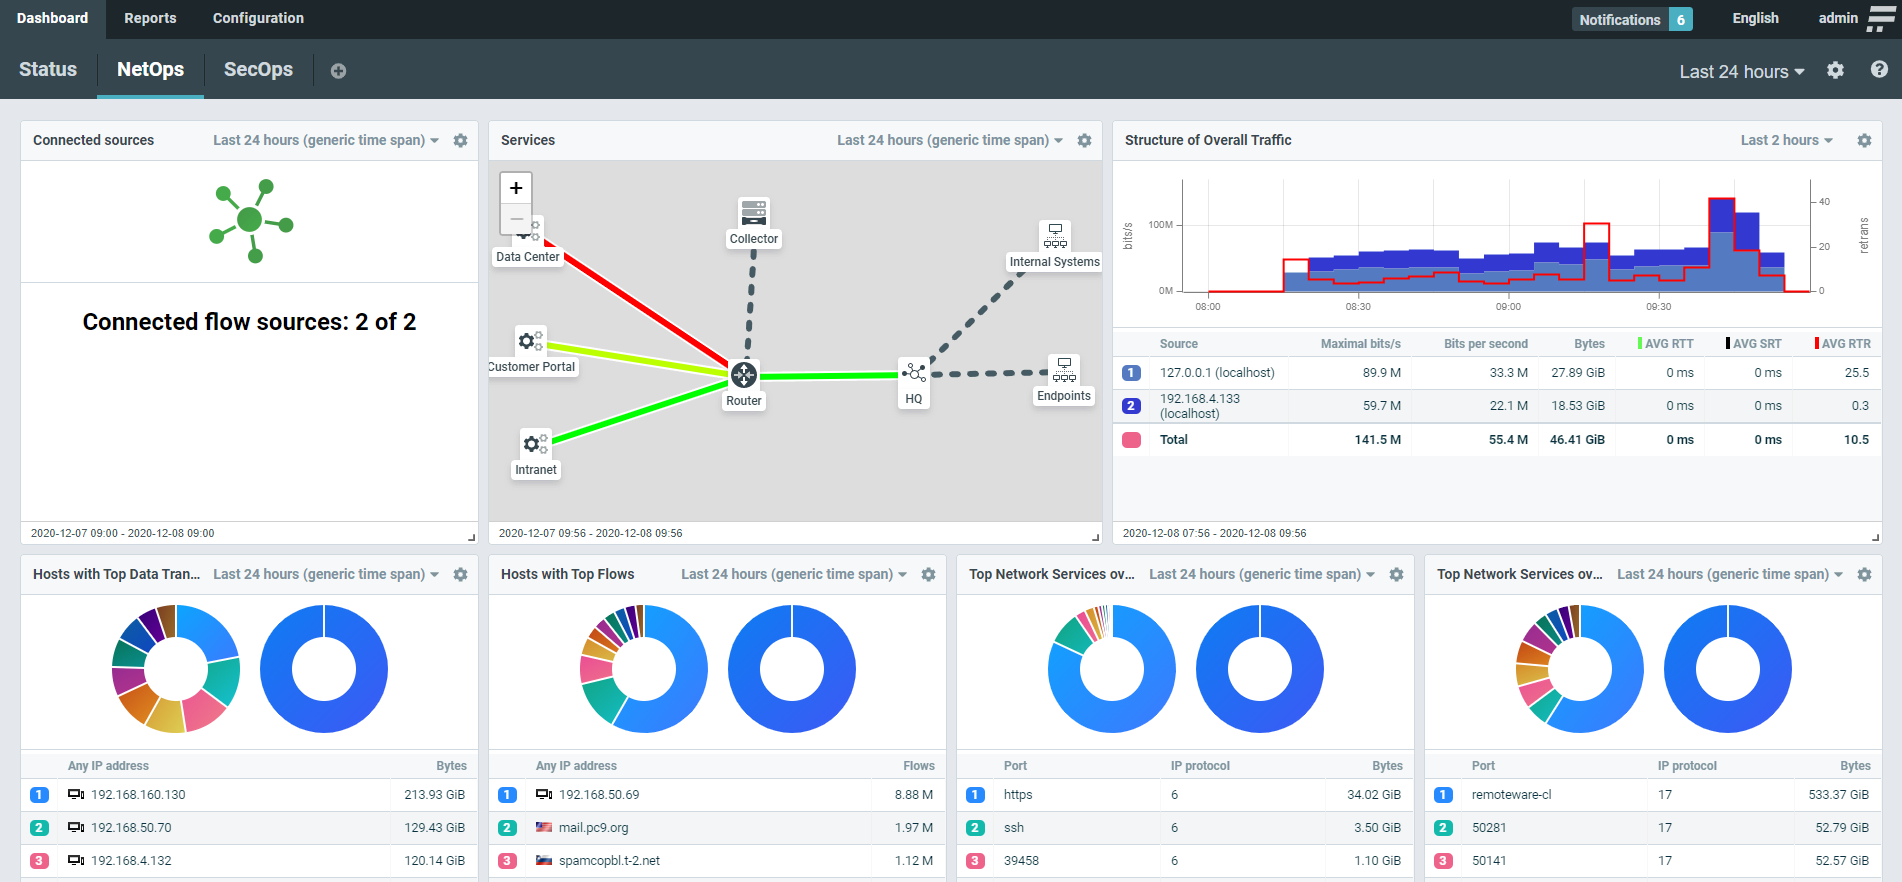
You may build your visualization as a map overlay to represent a geographical topology or as a graph for a logical view. A logical topology can include your sites, subnets, critical hosts, or services mapped to raw network telemetry to provide visual analytics and drill-downs where needed.
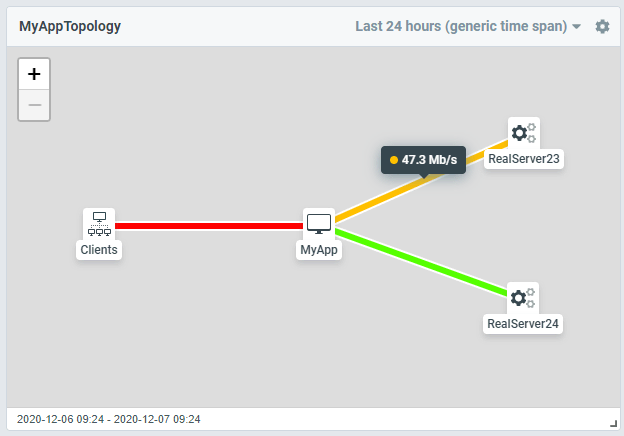
For instance, you can use topology graphs to show the network usage of a load-balanced application. Figure 4 below shows an application running on two servers with users accessing it.
Figure 4 A topology graph of a load-balanced application
Check for availability
In addition to SNMP, the live-check feature takes into account flow data received from the source to verify if it is delivering flows properly.
Figure 5 Flow source configuration dialog
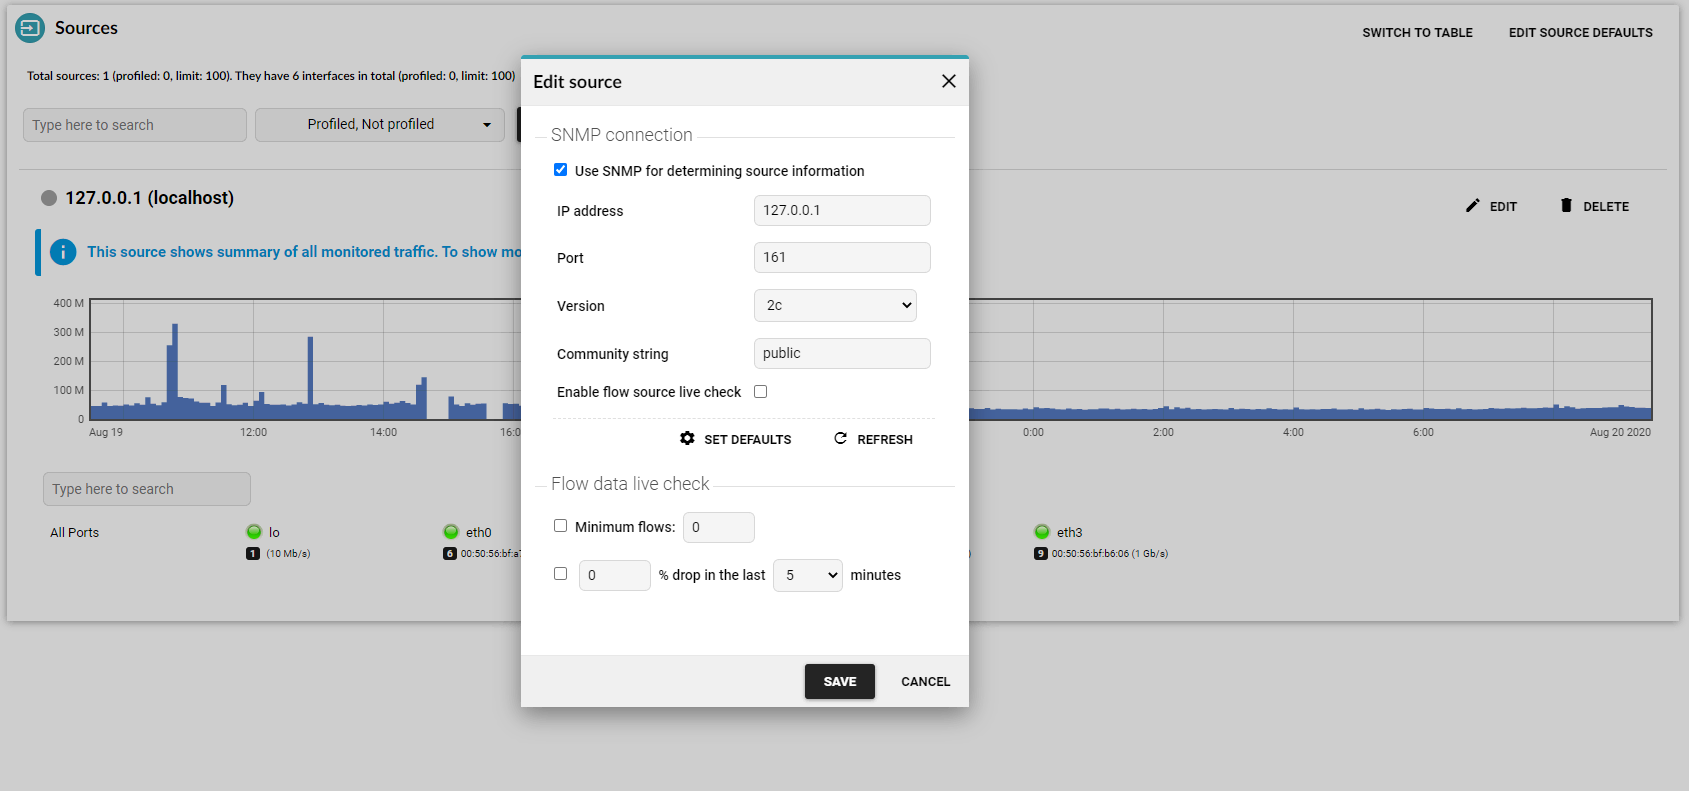
You can set up criteria such as the number of flows or a percentage drop over a given number of minutes.
Once either SNMP or the flow-based live check detects an issue, you receive a notification so that you may act immediately and make sure the collection of flow data resumes as it should.
Tinker with API
Our last worthy mention is that REST API documentation is now available in Swagger UI on every appliance.
Here, you have a description of every command accompanied by a preview, which dramatically simplifies control over the API interface. You can also execute a REST query against your Flowmon appliance and see the results immediately.
Figure 6 REST API commands in Swagger UI
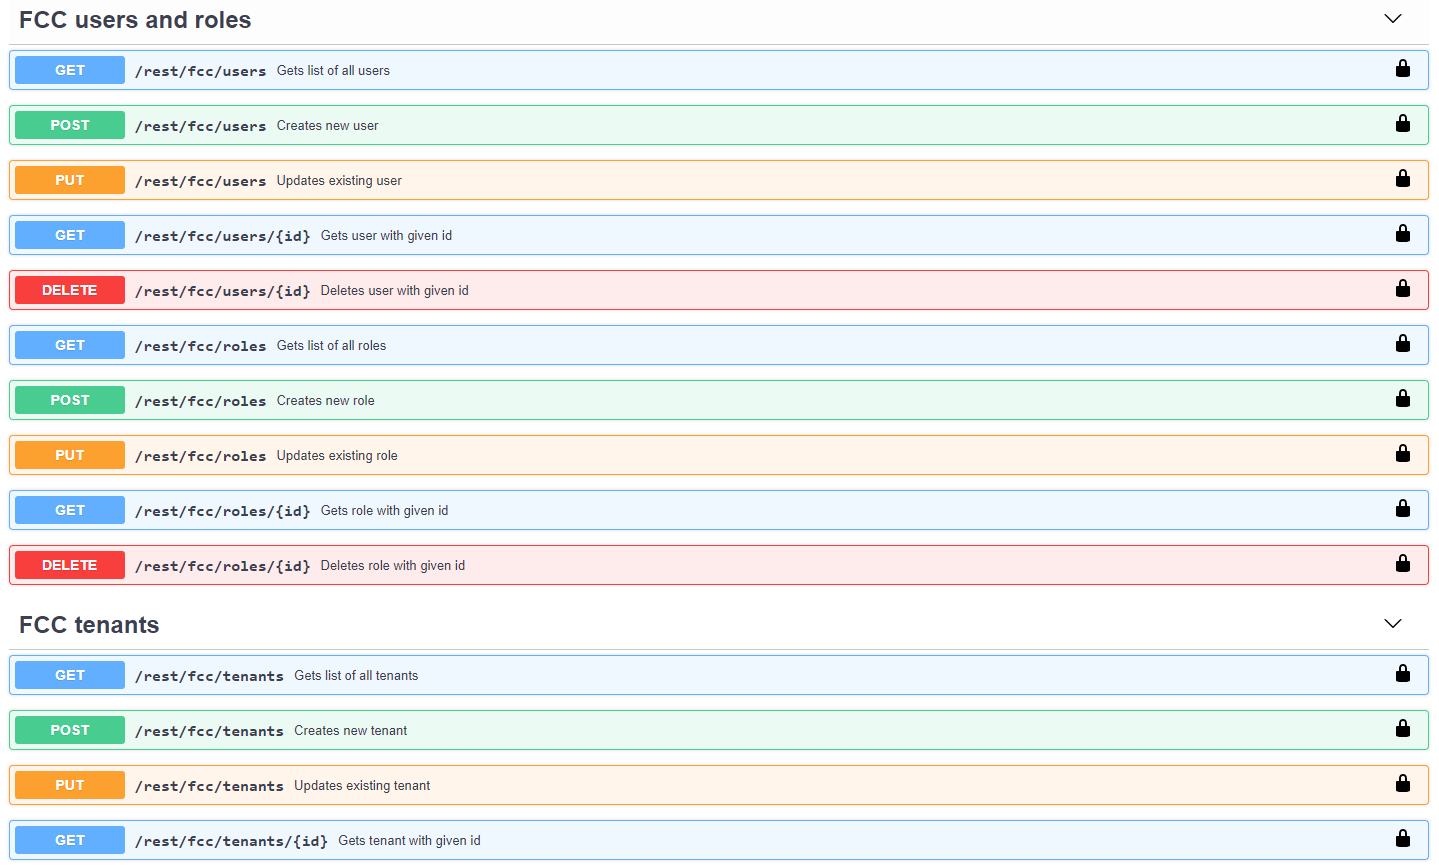
This change will make REST API for Flowmon much more human-friendly and accessible for a far broader user base as well as simplify development over API for IT professionals.
All about time-to-value
The new release of Flowmon 11.1 is an exciting evolutionary step in the spirit of instant information value and superior user ergonomy.
Do you have any feedback about Flowmon 11.1? Let us know!